


.png)


.png)
.png)


.png)


.png)
%201%20(1).png)

.png)


.png)


.png)
.png)


.png)


.png)

.png)
.png)
.png)
.png)
.png)
.png)
.png)
.png)
.png)


.png)


.png)

.png)
.png)


.png)


.png)
.png)
.png)
.png)

.png)
.png)


Research
Top Crypto Trading Platforms in 2025
When it comes to crypto trading platforms, Token Metrics is not an exchange, but a crypto analytics and crypto trading intelligence platform powered by AI.
Token Metrics Team
10


%201.svg)
%201.svg)
Big news: We’re cranking up the heat on AI-driven crypto analytics with the launch of the Token Metrics API and our official SDK (Software Development Kit). This isn’t just an upgrade – it's a quantum leap, giving traders, hedge funds, developers, and institutions direct access to cutting-edge market intelligence, trading signals, and predictive analytics.
Crypto markets move fast, and having real-time, AI-powered insights can be the difference between catching the next big trend or getting left behind. Until now, traders and quants have been wrestling with scattered data, delayed reporting, and a lack of truly predictive analytics. Not anymore.
The Token Metrics API delivers 32+ high-performance endpoints packed with powerful AI-driven insights right into your lap, including:
Getting started with the Token Metrics API is simple:
At Token Metrics, we believe data should be decentralized, predictive, and actionable.
The Token Metrics API & SDK bring next-gen AI-powered crypto intelligence to anyone looking to trade smarter, build better, and stay ahead of the curve. With our official SDK, developers can plug these insights into their own trading bots, dashboards, and research tools – no need to reinvent the wheel.
The Layer 1 landscape is consolidating as users and developers gravitate to chains with clear specialization. Bitcoin Cash positions itself as a payment-focused chain with low fees and quick settlement for everyday usage.
The scenario projections below map potential outcomes for BCH across different total crypto market sizes. Base cases assume steady usage and listings, while moon scenarios factor in stronger liquidity and accelerated adoption.

Disclosure
Educational purposes only, not financial advice. Crypto is volatile, do your own research and manage risk.
How to read it: Each band blends cycle analogues and market-cap share math with TA guardrails. Base assumes steady adoption and neutral or positive macro. Moon layers in a liquidity boom. Bear assumes muted flows and tighter liquidity.
TM Agent baseline:
Token Metrics lead metric for Bitcoin Cash, cashtag $BCH, is a TM Grade of 54.81%, which translates to Neutral, and the trading signal is bearish, indicating short-term downward momentum. This implies Token Metrics views $BCH as mixed value long term: fundamentals look strong, while valuation and technology scores are weak, so upside depends on improvements in adoption or technical development. Market context: Bitcoin has been setting market direction, and with broader risk-off moves altcoins face pressure, which increases downside risk for $BCH in the near term.
Live details:
Affiliate Disclosure: We may earn a commission from qualifying purchases made via this link, at no extra cost to you.
Token Metrics scenarios span four market cap tiers, each representing different levels of crypto market maturity and liquidity:


Each tier assumes progressively stronger market conditions, with the base case reflecting steady growth and the moon case requiring sustained bull market dynamics.
Bitcoin Cash represents one opportunity among hundreds in crypto markets. Token Metrics Indices bundle BCH with top one hundred assets for systematic exposure to the strongest projects. Single tokens face idiosyncratic risks that diversified baskets mitigate.
Historical index performance demonstrates the value of systematic diversification versus concentrated positions.
Bitcoin Cash is a peer-to-peer electronic cash network focused on fast confirmation and low fees. It launched in 2017 as a hard fork of Bitcoin with larger block capacity to prioritize payments. The chain secures value transfers using proof of work and aims to keep everyday transactions affordable.
BCH is used to pay transaction fees and settle transfers, and it is widely listed across major exchanges. Adoption centers on payments, micropayments, and remittances where low fees matter. It competes as a payment‑focused Layer 1 within the broader crypto market.
Token Metrics AI provides comprehensive context on Bitcoin Cash's positioning and challenges.
Vision:
Bitcoin Cash (BCH) is a cryptocurrency that emerged from a 2017 hard fork of Bitcoin, aiming to function as a peer-to-peer electronic cash system with faster transactions and lower fees. It is known for prioritizing on-chain scalability by increasing block sizes, allowing more transactions per block compared to Bitcoin. This design choice supports its use in everyday payments, appealing to users seeking a digital cash alternative. Adoption has been driven by its utility in micropayments and remittances, particularly in regions with limited banking infrastructure. However, Bitcoin Cash faces challenges including lower network security due to reduced mining hash rate compared to Bitcoin, and ongoing competition from both Bitcoin and other scalable blockchains. Its value proposition centers on accessibility and transaction efficiency, but it operates in a crowded space with evolving technological and regulatory risks.
Problem:
The project addresses scalability limitations in Bitcoin, where rising transaction fees and slow confirmation times hinder its use for small, frequent payments. As Bitcoin evolved into a store of value, a gap emerged for a blockchain-based currency optimized for fast, low-cost transactions accessible to the general public.
Solution:
Bitcoin Cash increases block size limits from 1 MB to 32 MB, enabling more transactions per block and reducing congestion. This on-chain scaling approach allows for faster confirmations and lower fees, making microtransactions feasible. The network supports basic smart contract functionality and replay protection, maintaining compatibility with Bitcoin's core architecture while prioritizing payment utility.
Market Analysis:
Bitcoin Cash operates in the digital currency segment, competing with Bitcoin, Litecoin, and stablecoins for use in payments and remittances. While not the market leader, it occupies a niche focused on on-chain scalability for transactional use. Its adoption is influenced by merchant acceptance, exchange liquidity, and narratives around digital cash. Key risks include competition from layer-2 solutions on other blockchains, regulatory scrutiny of cryptocurrencies, and lower developer and miner activity compared to larger networks. Price movements are often tied to broader crypto market trends and internal protocol developments. Despite its established presence, long-term growth depends on sustained utility, network security, and differentiation in a market increasingly dominated by high-throughput smart contract platforms.
Fundamental Grade: 80.41% (Community 62%, Tokenomics 100%, Exchange 100%, VC —, DeFi Scanner 72%).
Technology Grade: 29.63% (Activity 22%, Repository 70%, Collaboration 48%, Security —, DeFi Scanner 72%).
Can BCH reach $3,000?
Based on the scenarios, BCH could reach $3,000 in the 23T moon case and 31T base case. The 23T tier projects $3,446.53 in the moon case. Not financial advice.
Can BCH 10x from current levels?
At current price of $553.54, a 10x would reach $5,535.40. This falls within the 31T base and moon cases. Bear in mind that 10x returns require substantial market cap expansion. Not financial advice.
Should I buy BCH now or wait?
Timing depends on your risk tolerance and macro outlook. Current price of $553.54 sits below the 8T bear case in our scenarios. Dollar-cost averaging may reduce timing risk. Not financial advice.
Want exposure? Buy BCH on MEXC
Disclosure
Educational purposes only, not financial advice. Crypto is volatile, do your own research and manage risk.
Infrastructure protocols become more valuable as the crypto ecosystem scales and relies on robust middleware. Chainlink provides critical oracle infrastructure where proven utility and deep integrations drive long-term value over retail speculation. Increasing institutional adoption raises demand for professional-grade data delivery and security.
Token Metrics projections for LINK below span multiple total market cap scenarios from conservative to aggressive. Each tier assumes different levels of infrastructure demand as crypto evolves from speculative markets to institutional-grade systems. These bands frame LINK's potential outcomes into 2027.

Disclosure
Educational purposes only, not financial advice. Crypto is volatile, do your own research and manage risk.
How to read it: Each band blends cycle analogues and market-cap share math with TA guardrails. Base assumes steady adoption and neutral or positive macro. Moon layers in a liquidity boom. Bear assumes muted flows and tighter liquidity.
TM Agent baseline: Token Metrics lead metric for Chainlink, cashtag $LINK, is a TM Grade of 23.31%, which translates to a Sell, and the trading signal is bearish, indicating short-term downward momentum. This means Token Metrics currently does not endorse $LINK as a long-term buy at current conditions.
Live details: Chainlink Token Details
Affiliate Disclosure: We may earn a commission from qualifying purchases made via this link, at no extra cost to you.
Token Metrics scenarios span four market cap tiers, each representing different levels of crypto market maturity and liquidity:
8T: At an 8 trillion dollar total crypto market cap, LINK projects to $26.10 in bear conditions, $30.65 in the base case, and $35.20 in bullish scenarios.
16T: Doubling the market to 16 trillion expands the range to $42.64 (bear), $56.29 (base), and $69.95 (moon).
23T: At 23 trillion, the scenarios show $59.18, $81.94, and $104.70 respectively.
31T: In the maximum liquidity scenario of 31 trillion, LINK could reach $75.71 (bear), $107.58 (base), or $139.44 (moon).
Chainlink represents one opportunity among hundreds in crypto markets. Token Metrics Indices bundle LINK with top one hundred assets for systematic exposure to the strongest projects. Single tokens face idiosyncratic risks that diversified baskets mitigate.
Historical index performance demonstrates the value of systematic diversification versus concentrated positions.
Chainlink is a decentralized oracle network that connects smart contracts to real-world data and systems. It enables secure retrieval and verification of off-chain information, supports computation, and integrates across multiple blockchains. As adoption grows, Chainlink serves as critical infrastructure for reliable data feeds and automation.
The LINK token is used to pay node operators and secure the network’s services. Common use cases include DeFi price feeds, insurance, and enterprise integrations, with CCIP extending cross-chain messaging and token transfers.
Vision: Chainlink aims to create a decentralized, secure, and reliable network for connecting smart contracts with real-world data and systems. Its vision is to become the standard for how blockchains interact with external environments, enabling trust-minimized automation across industries.
Problem: Smart contracts cannot natively access data outside their blockchain, limiting their functionality. Relying on centralized oracles introduces single points of failure and undermines the security and decentralization of blockchain applications. This creates a critical need for a trustless, tamper-proof way to bring real-world information onto blockchains.
Solution: Chainlink solves this by operating a decentralized network of node operators that fetch, aggregate, and deliver data from off-chain sources to smart contracts. It uses cryptographic proofs, reputation systems, and economic incentives to ensure data integrity. The network supports various data types and computation tasks, allowing developers to build complex, data-driven decentralized applications.
Market Analysis: Chainlink is a market leader in the oracle space and a key infrastructure component in the broader blockchain ecosystem, particularly within Ethereum and other smart contract platforms. It faces competition from emerging oracle networks like Band Protocol and API3, but maintains a strong first-mover advantage and widespread integration across DeFi, NFTs, and enterprise blockchain solutions. Adoption is driven by developer activity, partnerships with major blockchain projects, and demand for secure data feeds. Key risks include technological shifts, regulatory scrutiny on data providers, and execution challenges in scaling decentralized oracle networks. As smart contract usage grows, so does the potential for oracle services, positioning Chainlink at the center of a critical niche, though its success depends on maintaining security and decentralization over time.
Fundamental Grade: 74.58% (Community 81%, Tokenomics 100%, Exchange 100%, VC —, DeFi Scanner 17%).
Technology Grade: 88.50% (Activity 81%, Repository 72%, Collaboration 100%, Security 86%, DeFi Scanner 17%).
Can LINK reach $100?
Yes. Based on the scenarios, LINK could reach $100+ in the 23T moon case. The 23T tier projects $104.70 in the moon case. Not financial advice.
What price could LINK reach in the moon case?
Moon case projections range from $35.20 at 8T to $139.44 at 31T. These scenarios assume maximum liquidity expansion and strong Chainlink adoption. Not financial advice.
Should I buy LINK now or wait?
Timing depends on risk tolerance and macro outlook. Current price of $18.09 sits below the 8T bear case in the scenarios. Dollar-cost averaging may reduce timing risk. Not financial advice.
Track live grades and signals: Token Details
Want exposure? Buy LINK on MEXC
Disclosure
Educational purposes only, not financial advice. Crypto is volatile, do your own research and manage risk.
Discover the full potential of your crypto research and portfolio management with Token Metrics. Our ratings combine AI-driven analytics, on-chain data, and decades of investing expertise—giving you the edge to navigate fast-changing markets. Try our platform to access scenario-based price targets, token grades, indices, and more for institutional and individual investors. Token Metrics is your research partner through every crypto market cycle.
The crypto market is tilting bullish into 2026 as liquidity, infrastructure, and participation improve across the board. Clearer rules and standards are reshaping the classic four-year cycle, flows can arrive earlier, and strength can persist longer than in prior expansions.
Institutional access is widening through ETFs and custody, while L2 scaling and real-world integrations help sustain on‑chain activity. This healthier backdrop frames our scenario work for HYPE. The ranges below reflect different total crypto market sizes and the share Hyperliquid could capture under each regime.

Disclosure
Educational purposes only, not financial advice. Crypto is volatile, do your own research and manage risk.
How to read it: Each band blends cycle analogues and market-cap share math with TA guardrails. Base assumes steady adoption and neutral or positive macro. Moon layers in a liquidity boom. Bear assumes muted flows and tighter liquidity.
TM Agent baseline: Token Metrics TM Grade is 73.9%, a Buy, and the trading signal is bearish, indicating short-term downward momentum. This means Token Metrics judges HYPE as fundamentally attractive over the long term, while near-term momentum is negative and may limit rallies.
Live details: Hyperliquid Token Details
Affiliate Disclosure: We may earn a commission from qualifying purchases made via this link, at no extra cost to you.
Scenario Analysis
Token Metrics scenarios span four market cap tiers, each representing different levels of crypto market maturity and liquidity:
8T: At an 8 trillion dollar total crypto market cap, HYPE projects to $48.81 in bear conditions, $49.92 in the base case, and $51.03 in bullish scenarios.
16T: Doubling the market to 16 trillion expands the range to $50.72 (bear), $54.05 (base), and $57.38 (moon).
23T: At 23 trillion, the scenarios show $52.62, $58.17, and $63.72 respectively.
31T: In the maximum liquidity scenario of 31 trillion, HYPE could reach $54.52 (bear), $62.29 (base), or $70.07 (moon).
Each tier assumes progressively stronger market conditions, with the base case reflecting steady growth and the moon case requiring sustained bull market dynamics.
Diversification matters. HYPE is compelling, yet concentrated bets can be volatile. Token Metrics Indices hold HYPE alongside the top one hundred tokens for broad exposure to leaders and emerging winners.
Our backtests indicate that owning the full market with diversified indices has historically outperformed both the total market and Bitcoin in many regimes due to diversification and rotation.
Hyperliquid is a decentralized exchange focused on perpetual futures with a high-performance order book architecture. The project emphasizes low-latency trading, risk controls, and capital efficiency aimed at professional and retail derivatives traders. Its token, HYPE, is used for ecosystem incentives and governance-related utilities.
Can HYPE reach $60?
Yes, the 23T and 31T tiers imply ranges above $60 in the Base and Moon bands, though outcomes depend on liquidity and adoption. Not financial advice.
Is HYPE a good long-term investment?
Outcome depends on adoption, liquidity regime, competition, and supply dynamics. Diversify and size positions responsibly.
Disclosure
Educational purposes only, not financial advice. Crypto is volatile, do your own research and manage risk.
Token Metrics delivers AI-based crypto ratings, scenario projections, and portfolio tools so you can make smarter decisions. Discover real-time analytics on Token Metrics.

Cryptocurrency is a digital form of money that exists on a decentralized network. Unlike traditional currencies like the dollar or euro, it isn’t controlled by a central bank or government. Instead, it uses cryptography to secure transactions, validate ownership, and prevent double-spending.
The most popular cryptocurrencies today include:
At the heart of all cryptocurrencies is blockchain technology — a distributed ledger that records transactions in a transparent, immutable, and secure manner.
A blockchain is a chain of blocks — each block containing a list of transactions. Every time a transaction occurs (like sending Bitcoin from Alice to Bob), it’s broadcast to a decentralized network of nodes. These nodes validate the transaction and add it to the blockchain.
Once added, it’s permanent and tamper-proof.
To ensure security, cryptocurrencies use consensus mechanisms like:
These systems remove the need for centralized authorities like banks.
To send and receive crypto, users need a wallet — a digital app or hardware device that stores private and public keys.
Most cryptocurrencies have limited supply. For example, Bitcoin has a max cap of 21 million coins. As supply decreases and demand increases, the price tends to go up — making crypto attractive to investors.
Now that you know how cryptocurrency works, the next question is: How do you invest smartly?
That’s where Token Metrics comes in — the best AI-powered crypto research platform for beginners, traders, and institutions.
Token Metrics uses machine learning models trained on 80+ metrics (technical, on-chain, fundamental, sentiment) to forecast prices for thousands of coins — helping you make data-driven decisions instead of guessing.
Each token is assigned two AI-generated grades:
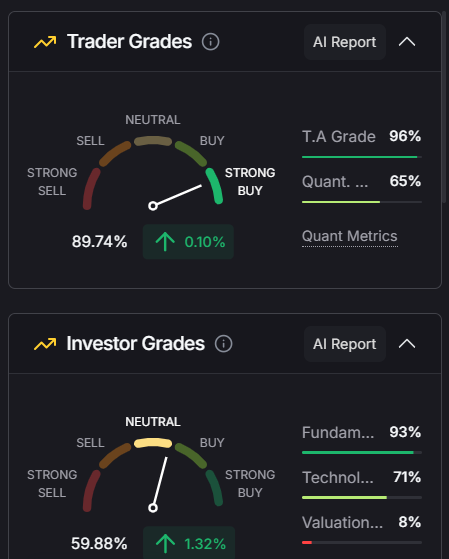
These grades update daily and help filter thousands of tokens instantly.

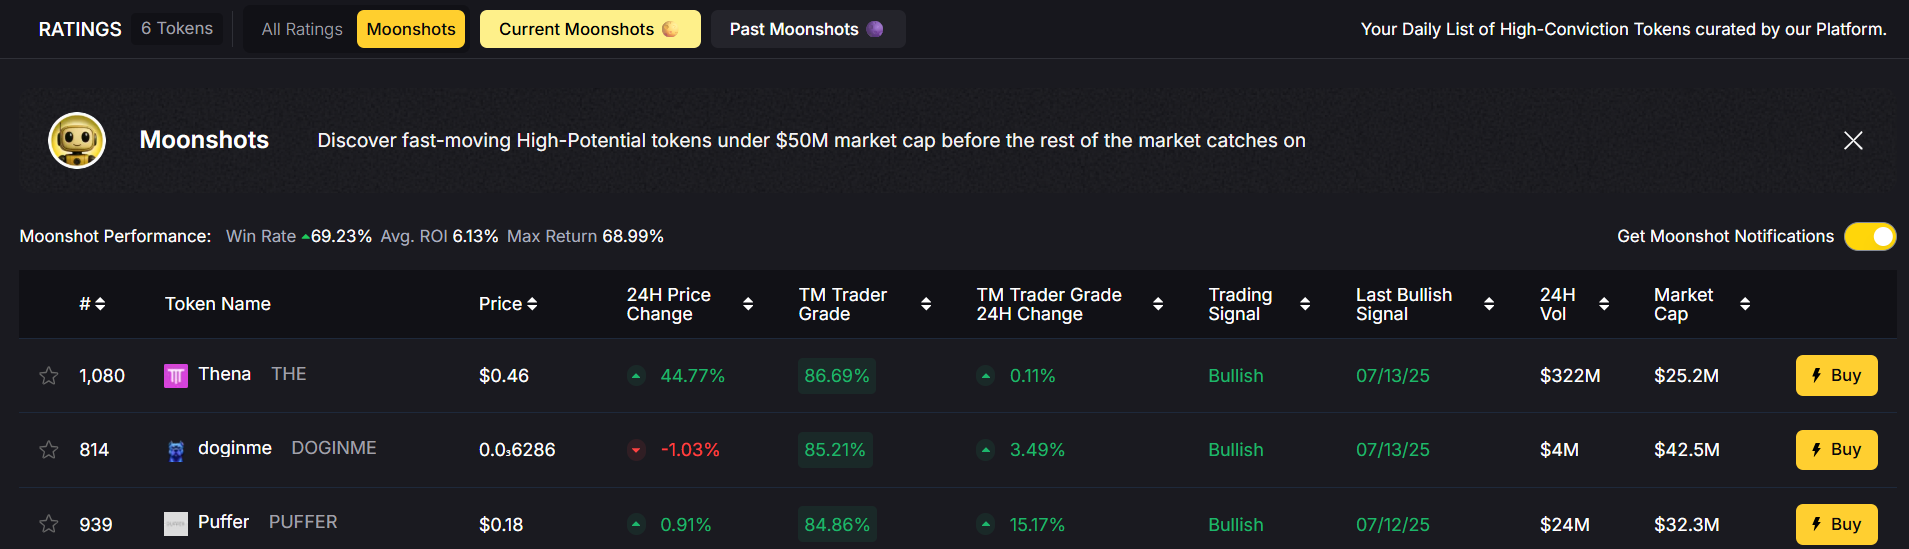
Want to find the next 100x altcoin? Token Metrics features a Moonshots tab, showcasing small-cap tokens with breakout potential based on AI momentum detection.
You can review:
Never miss a trade. Token Metrics sends instant alerts when tokens:
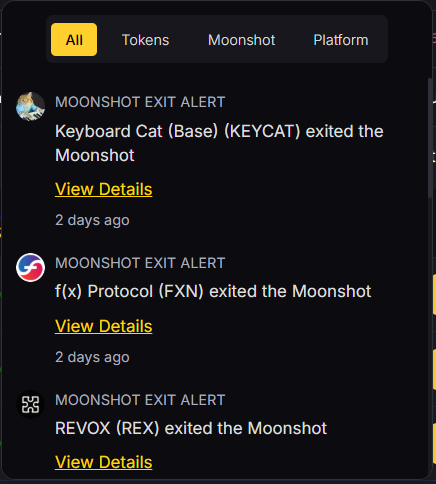
Alerts are available via:
Once you find a great coin, you can trade directly on Token Metrics using the built-in Swap Widget — no need to switch to another platform.
Want to integrate Token Metrics into AI agents or dev tools?
Use the MCP Server to connect real-time data with tools like:
With one Crypto API key, developers and data teams can query identical results across multiple tools — unlocking fast, consistent, and autonomous crypto infrastructure.
While crypto offers exciting opportunities, it’s important to be aware of potential risks:
Token Metrics helps you mitigate these risks by using AI to cut through the noise and focus on data that matters.
Cryptocurrency is evolving rapidly. Trends to watch include:
As crypto matures, platforms like Token Metrics will play a key role in helping users capitalize on opportunities intelligently.
Understanding how cryptocurrency works is essential for anyone looking to join the digital economy. From how blockchains secure transactions to how tokens gain value, crypto offers a radically transparent, decentralized financial system.
But success in crypto isn’t just about buying a coin and hoping it rises.
It’s about research. Timing. Strategy. And tools.
That’s why thousands of users trust Token Metrics — the all-in-one AI crypto platform that helps you:
Build a smart, diversified portfolio.

In the fast-paced world of crypto, everyone’s chasing the next 100x altcoin. But with thousands of tokens launching every month—and scams lurking around every corner—it’s natural to ask: “Is Moonshot legit?”
In 2025, one platform has gained massive attention for its AI-powered ability to surface early-stage altcoins before they explode: Token Metrics Moonshots.
This article takes a deep dive into what Moonshots are, how they work, and whether they’re truly legit—or just another overhyped crypto tool.
A moonshot refers to a low-market-cap cryptocurrency with the potential to grow exponentially—sometimes delivering 10x, 50x, or even 100x returns.
Moonshots typically:
But identifying moonshots early is hard without deep technical knowledge, insider access, or hours of research—until Token Metrics came along.
Token Metrics Moonshots is an AI-powered feature inside the Token Metrics platform that uses real-time data and advanced machine learning to surface high-potential altcoins before they pump.
Unlike meme calls on Telegram or Twitter influencers shilling bags, Moonshots are backed by structured data and AI analysis.
Token Metrics makes finding potential 100x coins as easy as clicking a few buttons. Here’s the exact process:
Each Moonshot includes:
Want to know if the algorithm works? Toggle to Past Moonshots to track actual results over 7–14 days. Many have shown 3x–9x returns in just a few days.
Token Metrics shows the live performance of every current and past Moonshot. You can verify:
This transparency builds trust. You’re not guessing—you’re measuring results.
Most “100x picks” online are based on hype or paid promotions. Moonshots are based on data—real metrics like:
That means no emotion, no bias, no hidden agendas.
In 2025, Moonshots helped users catch tokens before they were listed on major exchanges. Real examples from Q2 2025 include:

All of these were surfaced by Moonshots before they appeared in trending lists or news headlines.
Token Metrics is a well-known crypto research platform used by retail and institutional investors alike. Its tools have been featured in:
The Moonshots feature is just one layer of a larger AI analytics platform that includes:
If you’re already using Token Metrics, Moonshots is the fastest way to find early-stage altcoins backed by AI research.
No. Like any strategy in crypto, not every Moonshot performs. But the system is designed to identify tokens with strong probability of breakout, not guarantees.
That’s why you should:
In 2025, AI is outperforming human traders in speed, objectivity, and signal processing. Token Metrics trains its models on thousands of historical and real-time data points—delivering consistent, data-driven picks without emotional bias.
Moonshots are available on the Advanced Plan and higher. You can start with a 7-day free trial to test it out yourself.
Yes—Token Metrics Moonshots is a legit, AI-powered discovery tool for finding early-stage altcoins before they go viral.
It’s not a guaranteed win button. But it levels the playing field, giving everyday users access to tools once reserved for hedge funds and crypto insiders.
If you're tired of missing the next big altcoin pump or relying on influencer tips, Moonshots gives you back control—backed by real data.
Set custom alerts to get notified of new Moonshots

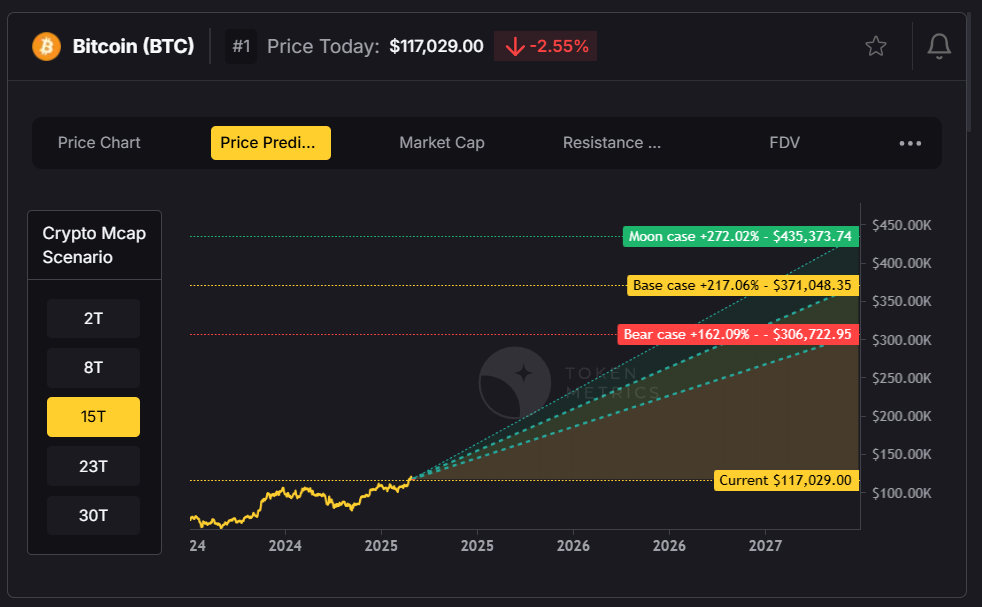
In mid‑2025, the crypto market is surging. Bitcoin (BTC) has blasted past $118,000, Ethereum (ETH) is over $3,000, and altcoins like XRP, ADA, and DOGE are back in focus. There’s one source powering many traders’ forecasts: Token Metrics, a leading AI‑driven crypto research and prediction platform. This extensive 1500‑word guide takes you through price forecasts, key drivers, risks, and how Token Metrics helps you stay ahead.
Before the altcoin specifics, it’s crucial to note that many digital assets are moving in tandem with Bitcoin. Token Metrics issued a bullish signal on Bitcoin on June 28, which quickly propelled BTC past the $110,000 resistance—a breakthrough that underscores fresh institutional momentum and on‑chain supply dynamics.

Token Metrics predicts $150,000–$230,000 range by 2026, averaging around $190,000, based on its AI model factoring in ETF flows, macro sentiment, and supply‑side trends.

If Bitcoin stays strong, Token Metrics forecasts ETH testing $5,000 to $10,000 by year‑end.

Bullish scenario: $5–$7 before year‑end, boosting to $10 if Bitcoin remains strong and the bullish momentum holds.
If ADA breaks $0.80, Token Metrics predicts $1.10–$1.65 by year‑end. Key zones:

With predictions like this, it’s essential to choose a research tool that delivers accuracy, objectivity, and automation. Token Metrics ticks every box:

We're witnessing one of the most powerful crypto bull cycles since 2021. Institutional capital, macro turbulence, and smart contract expansion are fueling gains across the board.
But this isn't about blind optimism—it's about precision entry, objective signals, and dynamic portfolio management.
That’s why Token Metrics stands out. Its AI forecasting platform offers tools that help investors:
Whether you're trading Bitcoin, Ethereum, or altcoins, Token Metrics equips you with tools to stay ahead. From real‑time signals, AI-predicted price targets, and custom alerts, to developer‑grade APIs, Token Metrics delivers a comprehensive crypto edge.
👉 Sign up now and level‑up your crypto portfolio strategy: tokenmetrics.com

Cryptocurrency is no longer just a buzzword — it’s a financial revolution. Since Bitcoin's creation in 2009, digital currencies have disrupted traditional finance, creating an entirely new class of assets. But what exactly is cryptocurrency, how does it work, and how can investors navigate this complex market with the help of tools like Token Metrics?
This comprehensive and SEO-optimized guide explains what cryptocurrency is, how it works, the different types available, and how platforms like Token Metrics help investors make smarter, AI-powered decisions.
Cryptocurrency is a digital or virtual form of money that uses cryptography for security. Unlike traditional fiat currencies like the U.S. Dollar or Euro, cryptocurrencies operate on decentralized networks — typically blockchain technology — that aren't controlled by governments or central banks.
At the heart of cryptocurrency is blockchain technology — a distributed ledger that records all transactions across a network of computers (called nodes). Each block contains a list of transactions, and once verified, it's added to the chain permanently.
If Alice sends 1 Bitcoin to Bob, this transaction is verified by nodes and added to the Bitcoin blockchain. No bank is involved, and no one can alter the record.
Thousands of cryptocurrencies exist today, but they typically fall into these categories:
The original and most well-known cryptocurrency. It's often viewed as "digital gold" due to its scarcity and store-of-value properties.
Any crypto that's not Bitcoin. Examples include:
Digital assets pegged to fiat currencies. Example: USDT (Tether), and USDC. These offer price stability and are widely used for trading and DeFi.
Tokens like Dogecoin (DOGE) or Shiba Inu (SHIB), driven largely by community hype and social media.
Tokens used within specific platforms, such as BNB for Binance or TMAI for Token Metrics.
Given the complexity and volatility of crypto, using a data-driven platform like Token Metrics can make a huge difference.
Token Metrics is an AI-powered crypto analytics and investment research platform that helps investors:
Token Metrics uses machine learning to forecast future price ranges for Bitcoin, Ethereum, and 6,000+ altcoins.
Each token is assigned a Trader Grade (short-term performance) and an Investor Grade (long-term fundamentals), updated daily using 80+ on-chain, technical, and sentiment data points.
Discover small-cap tokens with massive upside using the Moonshots tab, ranked by ROI, volume, grade changes, and time of entry.
Receive instant alerts via Telegram, email, Discord, or SMS for:
Dive deep into any project — fundamentals, top holders, historical grades, AI forecasts, and charting — all in one place.
Once you’ve done your research, trade instantly through Token Metrics with integrated swap functionality.
Step 1: Sign Up for Free
Visit tokenmetrics.com and choose a plan. Free users get 5,000 API calls per month and access to basic analytics.
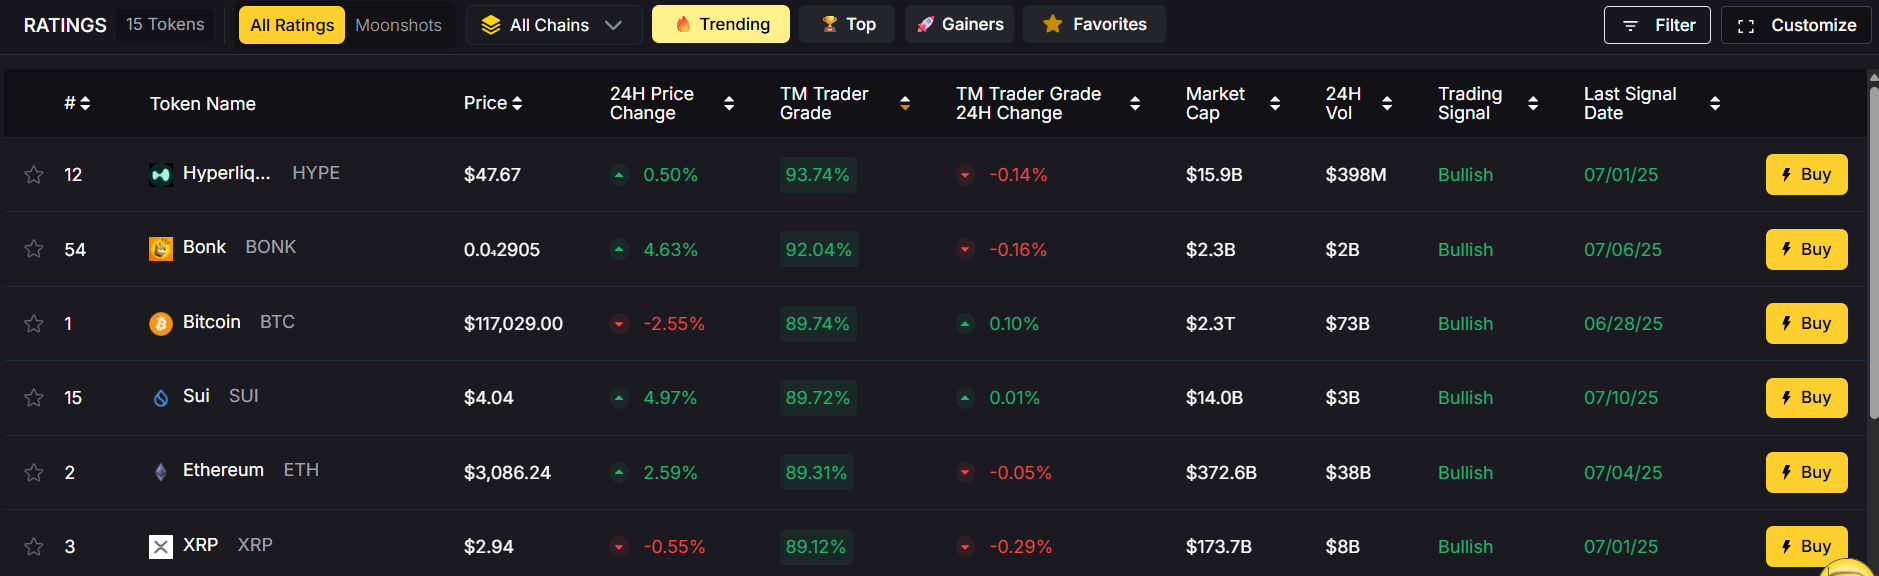
Step 2: Visit the Ratings Page This page ranks top-performing coins using AI grades and recent performance metrics.
Step 3: Click on Moonshots Looking for the next 100x gem? The Moonshots tab highlights tokens with exceptional short-term upside potential.
Step 4: Set Custom Alerts
Never miss a breakout. Customize alerts for price changes, grade shifts, or buy/sell signals.
Step 5: Explore Deep Research
Use Token Metrics’ detailed pages to analyze tokenomics, volume, investor behavior, and social sentiment.
Cryptocurrency is rapidly evolving. With institutional adoption rising, central banks exploring CBDCs, and retail interest growing, the market is entering a more mature phase.
Key trends:
Platforms like Token Metrics will become essential as investors need intelligent, unbiased tools to navigate this increasingly sophisticated market.
Cryptocurrency is changing how we think about money, ownership, and investing. But with great opportunity comes complexity. Whether you're a beginner or a seasoned trader, tools like Token Metrics give you the edge you need to:
Token Metrics isn’t just a research platform — it’s your AI-powered co-pilot in the crypto space.
%20Price%20Prediction%202025_%20Can%20the%20Meme%20Coin%20Hit%20%241.25%20This%20Bull%20Cycle_.png)
As of July 2025, Dogecoin (DOGE) is once again in the spotlight—trading near $0.20, its highest level in over a year. Powered by Bitcoin’s rally past $112,000, renewed interest from Elon Musk, and increasing institutional attention, DOGE is gaining bullish momentum. But can the original meme coin hit $1.00 or beyond in this bull cycle?

In this highly informative and SEO-optimized blog post, we break down the catalysts, technical setup, and risk factors for Dogecoin in 2025. Most importantly, we’ll explore how Token Metrics’ AI price prediction tools can help investors navigate the volatility and time DOGE trades with precision.

Bitcoin’s price blasting through $112,000 has triggered broad bullish sentiment across altcoins—especially meme tokens like DOGE. In every prior bull market, DOGE has benefited from retail euphoria and momentum trading when Bitcoin leads the charge.
With Bitcoin and Ethereum ETFs approved, attention is turning to the next wave of altcoin ETFs. Analysts believe:
Elon Musk remains one of Dogecoin’s biggest champions, now using DOGE as a payment option across:
His social media engagement continues to drive waves of DOGE buying—creating short-term surges and long-term loyalty.
More online platforms are integrating DOGE as a payment method. This includes:
Merchant adoption reinforces DOGE’s use case as a fast, low-fee transactional token.
On-chain data shows:
These are classic signals of a trend reversal and long-term bullish setup.
Based on fundamentals, on-chain metrics, and sentiment, here’s a breakdown of DOGE’s projected price scenarios:

Key Resistance to Break: $0.20, $0.30
Short-Term Support: $0.15
Critical Support: $0.12
Despite its meme coin charm, Dogecoin is not without risks:
Unlike Bitcoin, DOGE has no hard cap. It adds 5 billion DOGE per year, which:
DOGE relies heavily on social media buzz, influencer tweets, and trending memes. While this fuels rallies, it also:
Compared to Ethereum or Solana, DOGE lacks:
This limits its utility beyond payments and speculation.
With such a volatile asset, traders need more than gut feelings—they need data-backed predictions, AI-generated signals, and real-time alerts. That’s where Token Metrics shines.
Token Metrics uses deep learning models trained on:
These models provide short- and long-term predictions for DOGE—helping investors spot trends before they go viral.

DOGE signals on Token Metrics are updated daily and triggered by:
This gives traders a clear view of when to enter and exit—not based on hype, but on quantified momentum.
Each token—including DOGE—receives:
DOGE’s Trader Grade often spikes during retail-driven rallies, helping you catch the wave early.
DOGE’s Token Page on Token Metrics offers:

It’s the ultimate dashboard for anyone actively trading Dogecoin.
Never miss a DOGE breakout again. Token Metrics lets you:
It’s like having an AI trading assistant for DOGE, 24/7.
The answer depends on:
With a bullish setup in place and key macro trends aligned, DOGE hitting $0.55 to $1.25 by Q4 2025 is within reach.
But volatility will remain high—so timing, data, and discipline are critical.
Whether you’re a meme coin enthusiast or a data-driven trader, DOGE in 2025 presents real profit potential—especially with the right tools.
With Token Metrics, you can:
👉 Start your free trial at tokenmetrics.com
🚀 Explore the DOGE token page, check signal history, and set your moonshot alerts.
%20Price%20Prediction%202025_%20Can%20ADA%20Break%20%241.50%20This%20Bull%20Cycle_.png)
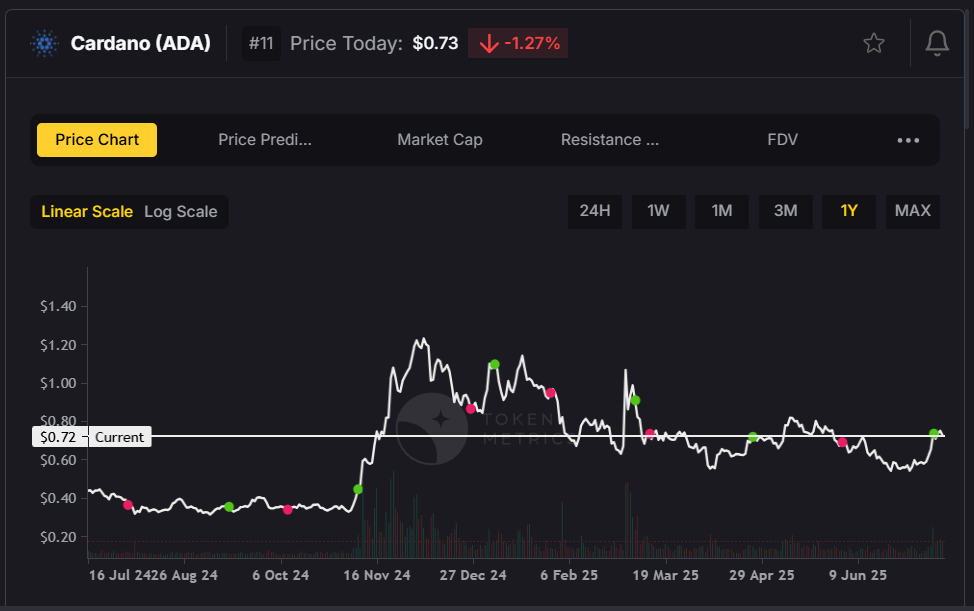
As of July 12, 2025, Cardano (ADA) is showing renewed strength, climbing toward the critical $0.75 resistance level as Bitcoin soars above $112,000. After months of consolidation, the smart contract platform is gaining attention from investors, driven by key upgrades, growing DeFi activity, and a broader crypto bull market.
But can ADA reclaim the $1.00 milestone—or even surge beyond $1.50—by the end of the year?
In this highly informative and SEO-optimized article, we’ll explore Cardano’s 2025 price outlook, fundamental drivers, potential risks, and how Token Metrics’ AI tools can help you make smarter, data-backed investment decisions.

The Plomin Hard Fork, implemented in Q1 2025, marked a turning point in Cardano’s evolution. It introduced:
This governance upgrade enhanced Cardano’s appeal to long-term investors and DeFi developers by aligning protocol evolution with community consensus.
Cardano’s DeFi ecosystem is gaining traction, with Total Value Locked (TVL) increasing by 21% since April. Leading protocols like Minswap, Indigo, and LiQwid have seen significant upticks in user activity and liquidity.
This growth signals:
Cardano could soon integrate Ripple’s newly launched $RLUSD stablecoin, offering:
Stablecoin adoption is a key growth driver for any Layer-1 network aiming to scale its DeFi infrastructure.
Cardano has attracted $73 million in institutional inflows in 2025 so far, according to data from leading asset managers. This shows:
With a 75% probability of ETF approval, institutional demand could surge further in Q4.
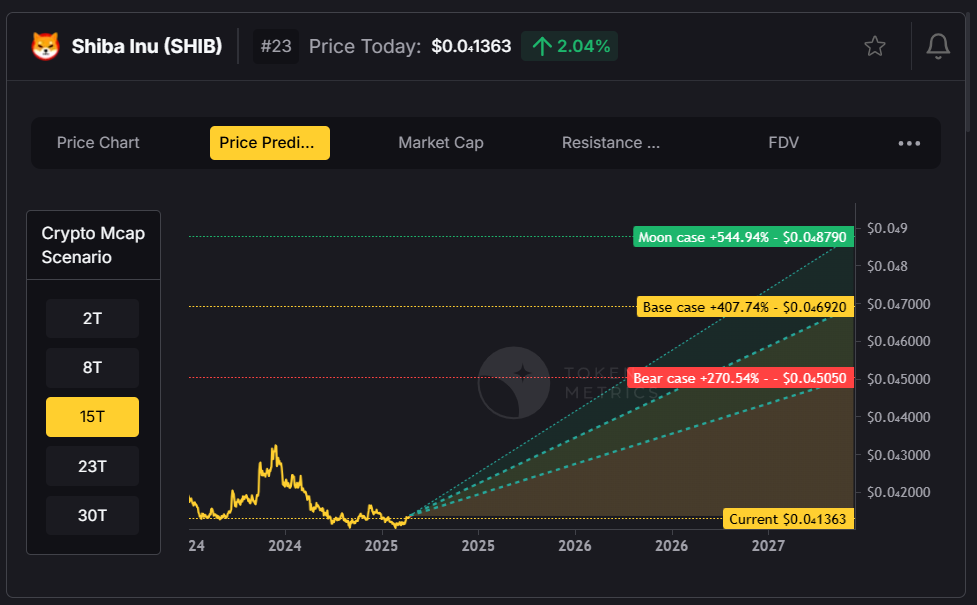
Analysts and machine learning models—including those from Token Metrics—project a bullish range for ADA in 2025, depending on technical and macroeconomic conditions.

Breakout Level to Watch: $0.80
Support to Hold: $0.62
Despite bullish fundamentals, Cardano still faces several challenges that could cap or delay price gains:
With only 30,000 daily active addresses, Cardano still lags behind competitors like:
Low user activity may:
Cardano must compete with:
ADA needs to differentiate itself with real-world adoption and enterprise use cases.
Even in a bull market, sharp corrections happen. ADA could:
In crypto’s high-volatility environment, AI-driven research tools are essential. Token Metrics empowers ADA investors with real-time signals, grades, and analytics to stay ahead of the market.
Token Metrics' machine learning models forecast ADA’s short- and long-term price movements based on:

These forecasts update in real time as market conditions evolve.
Grades are updated daily, providing clarity even during volatile market swings.
Token Metrics issues real-time bullish and bearish signals on ADA, helping users:
Each signal is backed by over 80 on-chain and technical data points.

ADA’s dedicated page includes:
It’s a comprehensive research hub for Cardano investors.
Set up personalized alerts for ADA based on:
Receive alerts via email, Discord, Telegram, or Slack, keeping you informed 24/7.
If ADA cannot break above $0.80, it may retrace toward:
In that case, investors should:
Cardano is making meaningful strides:
If these trends continue and Bitcoin remains in a bull cycle, ADA could reach $1.10–$1.65 by year-end.
However, investors should stay cautious of competition, user activity metrics, and potential volatility.
With Token Metrics, you can:
Ready to take advantage of Cardano’s potential?
👉 Visit tokenmetrics.com
🚀 Access AI price predictions, moonshot opportunities, and real-time signals
📲 Set custom alerts so you never miss a breakout
%20Price%20Prediction%202025_%20Will%20XRP%20Hit%20%2410%20This%20Bull%20Cycle_.png)
Ripple’s native token, XRP, is experiencing renewed momentum in 2025, surging to $2.58 and breaking the long-standing $2.50 resistance level. This price movement coincides with Bitcoin's rally past $112,000, signaling that XRP is riding the current bull market wave.
But what’s driving this surge in XRP? Is it sustainable? And could we see XRP hit $5, $7—or even $10—before the end of 2025?

In this highly informative and SEO-optimized blog post, we analyze the factors behind XRP’s rise, evaluate its future potential, and explain why Token Metrics’ AI-powered price prediction tools offer unmatched insights for crypto investors.
In July 2025, XRP’s breakout above $2.50 marks one of its strongest price performances since the 2017 bull run. Key drivers behind this bullish trend include:
Ripple finalized its years-long lawsuit with the U.S. Securities and Exchange Commission (SEC) by paying a $50 million settlement—without admitting XRP is a security. This outcome:
With the lawsuit resolved, XRP is now eligible for listings, ETF consideration, and greater adoption in regulated financial environments.
Ripple has successfully launched RLUSD, its native stablecoin backed 1:1 by U.S. dollars. RLUSD provides:
This ecosystem expansion strengthens Ripple’s value proposition and increases XRP utility and demand.
With Ethereum and Bitcoin ETFs already active, XRP is next in line. Analysts estimate:
ETF listings would make XRP easily accessible in retirement accounts, financial advisors’ portfolios, and wealth management platforms—further legitimizing the asset.
Ripple now boasts partnerships with 300+ financial institutions, including:
This positions XRP as a global standard for cross-border payments—a market worth $150+ trillion annually.
Analysts and AI models predict a strong upside potential for XRP during this bull cycle. Here's a breakdown of possible scenarios:

Breakout Level to Watch: $3.40
Support Level: $2.10
Despite the bullish momentum, XRP still faces several risks:
Although the SEC case is resolved, Ripple faces:
RLUSD must compete with:
Failure to achieve rapid RLUSD adoption could cap XRP's growth potential.
After explosive gains, whales may lock in profits, causing sharp pullbacks. Key support at $2.10 must hold to maintain bullish structure.
In a fast-moving market, investors need real-time, data-driven predictions—not guesswork. Token Metrics offers the most advanced tools for XRP investors.
Token Metrics uses machine learning models trained on years of crypto market data to generate high-accuracy price forecasts.
For XRP, these models consider:
The result? A forward-looking price forecast you can trust.
The Token Metrics platform issues real-time bullish or bearish signals based on:
These signals help you:
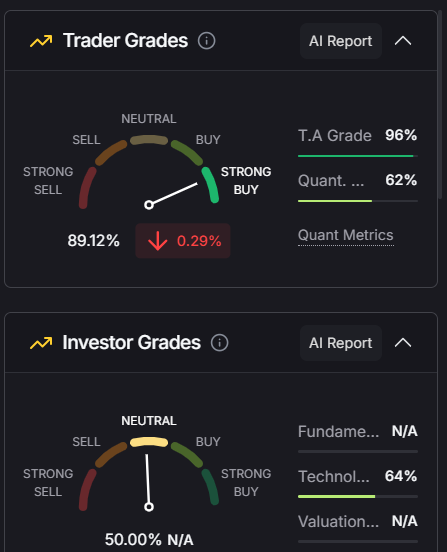
Token Metrics assigns every token—including XRP—a:
Both are AI-calculated using 80+ metrics, and they update daily. This helps you:
With Token Metrics, you can set personalized alerts for XRP:
Alerts are delivered via email, Slack, Telegram, or Discord—so you never miss a key movement.

The XRP profile page on Token Metrics provides:
Everything you need for informed XRP investing in one place.
While many altcoins are chasing narratives (AI, memecoins, DePIN), XRP’s case is fundamentally driven by:
Token Metrics’ crypto indices help investors diversify by creating thematic portfolios (e.g., “Institutional Adoption,” “Layer-1 Networks,” “Cross-Border Payments”)—with XRP often at the top of the cross-border category.

Corrections are part of every bull market. If XRP fails to hold above $2.50:
Use Token Metrics’ bearish signal alerts to de-risk in real time.
With legal clarity, a new stablecoin, ETF approval potential, and over 300 institutional partnerships, Ripple and XRP are in their strongest position in years.
If Bitcoin continues its uptrend and XRP breaks above $3.40, the next major rally could take it to $5–$10 by the end of 2025.
But success depends on regulatory support, stablecoin adoption, and institutional inflows—all factors Token Metrics tracks daily with precision.
👉 Start now at tokenmetrics.com and gain an edge in XRP trading and investing

Ethereum is once again at the center of attention in the crypto market. With its price surging past $3,000 and Bitcoin breaking above $112,000, many analysts now believe ETH could reach $5,000–$10,000 before the end of 2025.

This renewed momentum is backed by strong technical upgrades, institutional demand, and a thriving decentralized finance (DeFi) ecosystem. But can Ethereum overcome its challenges and hit a new all-time high? In this highly informative and SEO-optimized article, we’ll break down Ethereum’s 2025 price outlook—and show how Token Metrics’ AI-powered tools help investors track key price signals, monitor risk, and discover hidden opportunities.
Ethereum’s bullish breakout above $3,000 signals strong investor confidence. Several catalysts are driving this uptrend:

Ethereum’s highly anticipated Pectra upgrade is designed to improve scalability and transaction throughput. This upgrade will:
This scalability boost is expected to attract more developers, dApps, and users, further increasing demand for ETH.
Ethereum ETFs are gaining traction, with $12 billion in assets under management (AUM) as of July 2025. Major asset managers like Fidelity, BlackRock, and VanEck have brought ETH exposure to traditional finance.
These ETFs are:
Ethereum is now firmly on the radar of pension funds, family offices, and sovereign wealth funds.
Ethereum remains the undisputed leader in decentralized finance. As of July 2025:
Layer-2s help reduce fees, increase speed, and unlock new user growth. They are essential for Ethereum to scale while maintaining security.
With strong fundamentals, investor demand, and bullish momentum, here’s what analysts are forecasting:

Key breakout level to watch: $4,000
Key support level: $2,500
Despite bullish catalysts, Ethereum faces several potential headwinds that could slow or stall price growth:
Blockchains like Solana, Aptos, and Sui offer high-speed, low-cost alternatives. They continue to attract developers and DeFi projects due to:
Ethereum’s dominance could erode if it fails to keep pace with these innovations.
When usage surges, Ethereum gas fees can spike, pricing out retail users. This could limit dApp usage and reduce ETH demand during key moments in the bull cycle.
Though the U.S. has become more crypto-friendly, some regions still lack clear ETH guidance. New regulations affecting:
…could introduce market volatility.
In a market as fast-moving as crypto, investors need tools that offer real-time insights and predictive analytics. That’s where Token Metrics shines.
Token Metrics uses machine learning to forecast Ethereum’s short- and long-term price targets based on:
Its Ethereum model is continuously updated, adapting to market changes in real time.
These grades allow users to track Ethereum’s strength against thousands of other tokens.
Token Metrics issues daily buy/sell signals on Ethereum, helping users:
These signals are backed by AI algorithms that consider:
Set Ethereum alerts by:
Get alerts via email, Telegram, Discord, or Slack—so you never miss a trade.
Get all key ETH metrics in one place:
All powered by Token Metrics’ AI research engine.
To forecast Ethereum demand, investors should track:
Token Metrics includes Layer-2 project ratings and staking-related altcoin analysis for advanced users.
While $5,000–$10,000 is possible, ETH could face a correction if:
In that case, ETH could fall back to $2,500–$2,800, a key demand zone.
Token Metrics’ alerts and AI models help users manage risk and spot early trend reversals.
Ethereum has everything going for it in 2025:
If macro conditions remain favorable and Bitcoin sustains its rally, Ethereum could realistically test $10,000 before the end of the year.
But crypto markets remain volatile. Investors should use AI tools like Token Metrics to:
Ready to invest in Ethereum smarter?
👉 Sign up today at tokenmetrics.com and level up your crypto research game.

Cryptocurrency trading continues to evolve rapidly in 2025, driven by the rise of AI, automation, and real-time analytics. Choosing the right platform is critical to your success as a trader or investor. In this comprehensive guide, we’ll explore the top 5 crypto trading platforms in July 2025, explain what crypto trading is, discuss its different types, and show why Token Metrics stands out as the best AI-powered analytics and moonshot discovery platform.
Crypto trading involves buying and selling cryptocurrencies like Bitcoin (BTC), Ethereum (ETH), and thousands of altcoins on digital platforms to make a profit. Traders capitalize on price fluctuations by entering positions in the market—either manually or using automation.
Unlike traditional stock trading, crypto trading is:
There are several crypto trading strategies and approaches depending on your goals, risk tolerance, and available tools:
Buying and selling actual cryptocurrencies at current market prices. It’s simple and widely used by beginners.
Using borrowed funds to increase exposure. This amplifies gains but also increases risk.
Traders speculate on future prices using products like futures and options without owning the underlying assets.
A short-term strategy that aims to profit from small price movements—often requiring advanced bots or tools.
Holding a position for several days or weeks to capitalize on medium-term trends.
Using algorithms or AI to execute trades based on predefined strategies or signals.
Mimicking the trades of successful traders through social platforms.
Here are the best platforms based on performance, tools, security, and innovation:

Website: tokenmetrics.com
Token Metrics is not a traditional exchange but a powerful AI-driven analytics and trading platform. It helps users discover high-potential tokens, evaluate them using real-time data, and automate smarter trades.
Token Metrics empowers retail traders and institutional investors with AI precision, data transparency, and deep insights that traditional platforms simply don’t offer.
Why It Stands Out: No other platform blends AI-driven analytics, moonshot discovery, and real-time alerts with developer tools at this scale. It’s ideal for both hands-on traders and automated trading systems.

Website: binance.com
Binance is the largest centralized exchange by volume and offers extensive spot, margin, and futures trading. It supports hundreds of tokens and provides access to a robust launchpad, NFT marketplace, and staking.
Best For: Professional traders seeking high liquidity and advanced tools.

Website: coinbase.com
Coinbase is the go-to platform for beginners and U.S. traders. It provides an intuitive interface, secure storage, and educational resources.
Best For: Beginners and passive investors in regulated regions.

Website: kraken.com
Kraken is known for its strong security protocols and staking services. It offers spot, margin, and futures trading with a reputation for transparency.
Best For: Traders prioritizing security and staking rewards.

Website: bitget.com
Bitget is gaining popularity for its copy trading features and derivatives market. It allows users to replicate the trades of successful investors automatically.
Best For: Passive traders and futures enthusiasts.
While exchanges like Binance and Coinbase focus on execution, Token Metrics gives you the intelligence to know what to trade and when. Its AI-powered platform serves as the brain behind your trades—scanning thousands of tokens daily and distilling actionable insights in real time.
Whether you want to:
…Token Metrics is the most powerful analytics and trading assistant available in 2025.
Choosing the best crypto trading platform depends on your trading style and goals. For execution, Binance and Coinbase remain strong contenders. But if you're looking to gain an unfair advantage through AI, automate your workflow, and catch the next 10x altcoin before the crowd, Token Metrics is unmatched.
As AI continues to reshape crypto in 2025, platforms like Token Metrics will become the go-to infrastructure for intelligent investing. Don’t just trade crypto—trade with insight.


9450 SW Gemini Dr
PMB 59348
Beaverton, Oregon 97008-7105 US
.svg)


.png)
Token Metrics Media LLC is a regular publication of information, analysis, and commentary focused especially on blockchain technology and business, cryptocurrency, blockchain-based tokens, market trends, and trading strategies.
Token Metrics Media LLC does not provide individually tailored investment advice and does not take a subscriber’s or anyone’s personal circumstances into consideration when discussing investments; nor is Token Metrics Advisers LLC registered as an investment adviser or broker-dealer in any jurisdiction.
Information contained herein is not an offer or solicitation to buy, hold, or sell any security. The Token Metrics team has advised and invested in many blockchain companies. A complete list of their advisory roles and current holdings can be viewed here: https://tokenmetrics.com/disclosures.html/
Token Metrics Media LLC relies on information from various sources believed to be reliable, including clients and third parties, but cannot guarantee the accuracy and completeness of that information. Additionally, Token Metrics Media LLC does not provide tax advice, and investors are encouraged to consult with their personal tax advisors.
All investing involves risk, including the possible loss of money you invest, and past performance does not guarantee future performance. Ratings and price predictions are provided for informational and illustrative purposes, and may not reflect actual future performance.


%20Price%20Prediction%202025%2C%202030%20-%20Forecast%20Analysis.png)


.png)

%20Price%20Prediction%20.webp)


%20Price%20Prediction.webp)


%20Price%20Prediction%20Analysis%20-%20Can%20it%20Reach%20%24500%20in%20Future_.png)


