
.png)


.png)

.png)


.webp)


.png)


.png)
.png)


.png)


.png)
%201%20(1).png)

.png)


.png)


.png)
.png)


.png)


.png)

.png)
.png)
.png)
.png)
.png)
.png)
.png)
.png)
.png)


.png)


.png)


.png)


.png)
.png)
.png)
.png)

.png)
.png)


Research
Top Crypto Trading Platforms in 2025
When it comes to crypto trading platforms, Token Metrics is not an exchange, but a crypto analytics and crypto trading intelligence platform powered by AI.
Token Metrics Team
10


%201.svg)
%201.svg)
Big news: We’re cranking up the heat on AI-driven crypto analytics with the launch of the Token Metrics API and our official SDK (Software Development Kit). This isn’t just an upgrade – it's a quantum leap, giving traders, hedge funds, developers, and institutions direct access to cutting-edge market intelligence, trading signals, and predictive analytics.
Crypto markets move fast, and having real-time, AI-powered insights can be the difference between catching the next big trend or getting left behind. Until now, traders and quants have been wrestling with scattered data, delayed reporting, and a lack of truly predictive analytics. Not anymore.
The Token Metrics API delivers 32+ high-performance endpoints packed with powerful AI-driven insights right into your lap, including:
Getting started with the Token Metrics API is simple:
At Token Metrics, we believe data should be decentralized, predictive, and actionable.
The Token Metrics API & SDK bring next-gen AI-powered crypto intelligence to anyone looking to trade smarter, build better, and stay ahead of the curve. With our official SDK, developers can plug these insights into their own trading bots, dashboards, and research tools – no need to reinvent the wheel.
Most cryptocurrency content focuses on quick profits, overnight riches, and short-term trading gains. This creates the misconception that crypto exists solely for speculation rather than serious wealth building. The reality? Cryptocurrency represents one of the most powerful tools available for long-term retirement planning when approached with discipline and proper strategy.
Token Metrics AI Indices provide the framework for incorporating cryptocurrency into retirement portfolios intelligently. Rather than gambling on individual tokens or timing markets perfectly, systematic index investing builds wealth gradually over decades through compound growth, professional management, and strategic diversification.
This comprehensive guide explores how to use crypto indices for retirement planning, comparing traditional retirement vehicles to crypto options, calculating realistic retirement scenarios, and building multi-decade investment strategies that could transform your financial future.
Traditional retirement planning relies on stocks, bonds, and real estate. Adding cryptocurrency exposure enhances portfolios through several key mechanisms:
A $10,000 investment growing at 40% annually becomes $289,000 in 10 years and over $8 million in 20 years, compared to traditional 8-10% returns producing $46,000-67,000 in 20 years.
Appropriate cryptocurrency allocation varies dramatically based on age and time until retirement. Here's how to structure crypto index exposure across different life stages.
Young investors possess retirement timelines of 30-45 years, allowing aggressive crypto allocation with time to recover from potential downturns.
At this age, even 80% portfolio declines during severe bear markets can be recovered within 5-10 years through continued contributions and market recovery. The extraordinary upside potential of aggressive crypto indices justifies accepting higher volatility.
Dollar-cost average aggressively during this phase. Invest consistently whether markets surge or crash—time in market beats timing the market over multi-decade horizons. A disciplined 25-year-old investing $500 monthly in crypto indices could accumulate millions by retirement.
Mid-career professionals have 15-30 years until retirement, requiring balance between growth and preservation.
This age bracket still allows recovery from market downturns but requires more caution. Your portfolio has grown substantially through career earnings and investment gains—protecting accumulated wealth becomes increasingly important while maintaining growth exposure.
Continue regular contributions but consider taking partial profits during euphoric market conditions to rebalance back to target allocations. This systematic profit-taking locks in gains while maintaining disciplined exposure.
Pre-retirement investors have 5-15 years until retirement, requiring capital preservation focus while maintaining some growth exposure.
Near-retirement portfolio declines prove difficult to recover before accessing funds. Conservative crypto indices focusing on Bitcoin, Ethereum, and fundamentally strong large-caps provide continued growth potential with substantially reduced volatility compared to aggressive indices.
This phase should involve gradually reducing crypto allocation through systematic profit-taking if positions have appreciated significantly. Lock in life-changing gains rather than risking everything on continued appreciation.
Retirees and near-retirees require income generation and capital preservation, making crypto allocation more cautious.
At this stage, crypto serves primarily as portfolio diversifier and inflation hedge rather than primary growth driver. Conservative indices provide stability while avoiding volatility that could disrupt retirement cash flow needs.
Consider this allocation as "money you won't need for 10+ years" even in retirement. Maintain traditional income-generating assets for living expenses while crypto serves as long-term appreciation component.
The most powerful retirement investing occurs in tax-advantaged accounts where compound growth accelerates without annual tax drag.
Understanding how crypto indices could impact your retirement requires running realistic projections based on various return scenarios.
If crypto indices deliver 20% annualized returns—substantially below historical performance but conservative for mature markets—the impact on retirement wealth remains significant.
Example: $10,000 initial investment with $500 monthly contributions over 30 years at 20% annual returns grows to approximately $2.8 million. The same contributions at traditional 8% returns grow to $680,000. The additional $2.1 million from crypto allocation transforms retirement completely.
If crypto indices achieve 35% annualized returns—possible given historical performance and continued sector growth—wealth accumulation accelerates dramatically.
Example: Same $10,000 initial investment with $500 monthly contributions over 30 years at 35% returns grows to approximately $18.5 million. This level of wealth provides complete financial freedom and generational wealth transfer opportunities.
If crypto indices deliver 50% annualized returns—achievable during optimal conditions though not guaranteed—retirement wealth reaches extraordinary levels.
Example: $10,000 initial with $500 monthly over 30 years at 50% returns produces approximately $86 million. While this scenario seems unrealistic, early cryptocurrency adopters achieved even higher returns.
Real returns won't be linear—expect bull markets delivering 200-500% returns alternating with bear markets producing 50-80% drawdowns. Over complete cycles, conservative average returns of 25-40% annually seem reasonable for diversified crypto index exposure.
These projections illustrate why even small crypto allocations dramatically impact long-term retirement wealth. A 10% crypto allocation returning 30% annually while 90% traditional assets return 8% produces blended portfolio returns of 10.2%—significantly enhancing retirement outcomes.
Cryptocurrency's volatility creates legitimate concerns for retirement investors. Managing this volatility while capturing growth requires specific strategies.
Gradually reduce crypto allocation as retirement approaches through systematic rebalancing. This glide path approach—similar to target-date retirement funds—reduces volatility exposure as time horizon shortens.
Start with higher allocations (15-25%) in your 20s-30s, gradually reducing to 10-15% in 40s, 5-10% in 50s, and 3-5% in retirement. This systematic reduction locks in gains while managing risk appropriately for age.
Set specific portfolio allocation targets and rebalance quarterly or annually. When crypto appreciates significantly beyond target allocation, sell portions to rebalance back. When crypto declines below target, add to positions during market weakness.
This mechanical rebalancing forces buying low and selling high—the opposite of emotional investing. Over decades, disciplined rebalancing dramatically improves risk-adjusted returns.
Never invest emergency funds or money needed within 5 years in cryptocurrency. Maintain 6-12 months expenses in cash or stable value accounts separate from crypto allocation. This ensures market volatility doesn't force selling during downturns.
Retirement planning works best when crypto represents "money you won't need for 10+ years." This timeframe allows riding out market cycles without forced selling during temporary declines.
Continue systematic contributions regardless of market conditions. Dollar-cost averaging reduces timing risk and smooths out entry prices across bull and bear markets. The worst-performing investment strategy is investing large sums at market tops—DCA prevents this mistake.
Set up automatic monthly or bi-weekly investments and maintain through all market conditions. Over 20-30 year retirement timelines, consistent DCA produces exceptional results even if individual timing proves poor.
Creating an effective long-term strategy requires comprehensive planning addressing allocation, execution, adjustment, and monitoring.
Focus this phase on building foundational positions and establishing sustainable contribution habits. Don't obsess over short-term performance—focus on consistency.
This phase typically coincides with peak earning years. Maximize the power of compound growth by contributing aggressively while maintaining disciplined rebalancing.
As retirement approaches, capital preservation becomes increasingly important. Take chips off the table while maintaining some exposure for continued growth and inflation protection.
In retirement, crypto serves as long-term growth component rather than primary income source. Spend traditional assets while crypto appreciates, potentially leaving substantial wealth for heirs.
Retirement planning with cryptocurrency doesn't require speculation, perfect timing, or excessive risk-taking. Token Metrics AI Indices provide systematic, professional, diversified exposure allowing disciplined long-term wealth building.
The choice is stark: maintain 100% traditional asset allocation and likely achieve comfortable but conventional retirement, or incorporate strategic crypto allocation potentially transforming retirement wealth completely. Even conservative 5-10% crypto allocations dramatically enhance retirement outcomes over multi-decade horizons.
Your advantage is time. Compound growth over 20-40 years turns modest contributions into life-changing wealth. Crypto's superior growth potential—even if moderated from historical levels—provides retirement enhancement unavailable through traditional assets alone.
The risks are manageable through proper allocation, diversification, and disciplined rebalancing. The opportunity cost of complete avoidance grows with every passing year. Markets won't wait for perfect confidence—they reward those who begin with imperfect action.
Token Metrics provides the tools, strategy, and professional management transforming crypto from speculation into serious retirement planning. Your future self will thank you for making strategic allocation decisions today rather than watching opportunities pass from the sidelines.
Start your 7-day free trial today and begin building the retirement you deserve through systematic, professional crypto index investing. Financial freedom awaits those willing to embrace opportunity with discipline and strategy.
Cryptocurrency investing intimidates many potential investors. The technical jargon, overwhelming number of tokens, security concerns, and stories of people losing fortunes create paralysis. You know crypto represents an opportunity, but where do you even begin?
Token Metrics AI Indices eliminate these barriers by providing a simple, secure pathway into cryptocurrency investing. Whether you've never bought crypto before or you're transitioning from traditional investments, this comprehensive beginner's guide walks you through everything needed to start investing successfully in just 30 minutes.
No technical expertise required. No complicated wallet setup. No endless research into thousands of tokens. Just straightforward steps that get you invested intelligently and positioned for long-term wealth creation.
Before diving into the how-to, let's establish a simple understanding of what you're investing in.
Think of crypto indices like a basket containing multiple cryptocurrencies. Instead of buying Bitcoin or Ethereum individually, you buy a pre-made collection of several carefully selected digital assets. This is similar to how traditional stock index funds like the S&P 500 contain hundreds of companies rather than forcing you to pick individual stocks.
Token Metrics creates these baskets using artificial intelligence that analyzes thousands of cryptocurrencies and selects the best ones based on comprehensive data. The AI acts like a team of expert analysts working 24/7, constantly monitoring market conditions and adjusting your portfolio to maximize returns while managing risk.
When you invest in a Token Metrics index, you're essentially hiring sophisticated AI technology to build and manage your crypto portfolio professionally. You get instant diversification across multiple tokens, automatic rebalancing when market conditions change, protection from common investing mistakes, and access to opportunities you'd never find independently.
The beauty of this approach is simplicity. You don't need to understand blockchain technology, read complicated whitepapers, or analyze trading charts. The AI handles complexity while you focus on your life and watch your investment grow.
For beginners, indices provide the perfect entry point—immediate diversification, professional management, emotion-free investing, and minimal time commitment. You can start small, learn gradually, and scale up as you become comfortable.
Ready to begin? Follow this simple roadmap to go from complete beginner to invested in under 30 minutes.
After your initial investment, understanding ongoing management helps you stay invested successfully.
Token Metrics indices rebalance regularly as market conditions change. You'll receive notifications when adjustments are recommended. These typically occur weekly, bi-weekly, or monthly. Follow the recommendations by making small adjustments—usually just a few minutes to execute.
Check your portfolio monthly rather than daily. Cryptocurrency volatility means dramatic day-to-day swings. Monthly reviews allow tracking overall trajectory without getting caught up in noise. Token Metrics provides performance tracking tools showing returns over various periods and comparing to benchmarks.
Occasionally rebalance your overall portfolio allocation. If crypto has grown from 10% to 25% of your total investments, consider taking profits to rebalance back to your target. This ensures you don't become overexposed during market euphoria.
New investors often have the same questions and concerns. Here are straightforward answers.
"Is crypto investing safe?"
Cryptocurrency carries risk like all investments. However, indices are far safer than buying random tokens. Token Metrics' AI vetting filters out scams, diversification reduces risk, and professional management protects against emotional mistakes.
"What if I lose everything?"
This is why you only invest money you can afford to lose. Crypto indices are diversified across multiple assets, making total loss extremely unlikely. Individual tokens can fail, but portfolios of 10-30 carefully selected tokens provide resilience.
"How much can I make?"
Token Metrics indices have historically delivered returns significantly exceeding Bitcoin and Ethereum. Conservative indices might return 100-200% annually during bull markets. Aggressive indices could deliver 300-500%+. Bear markets may see negative returns—long-term holding is essential.
"What about taxes?"
Cryptocurrency transactions trigger capital gains taxes in most jurisdictions. Keep records of all transactions. Token Metrics provides transaction tracking to simplify tax preparation. Consult a tax professional for personalized guidance.
"Do I need a special wallet?"
For beginners with smaller amounts, keeping crypto on a reputable exchange is acceptable. As holdings grow beyond $10,000, consider a hardware wallet for additional security.
"Can I start with just $100?"
Yes! While larger amounts generate more absolute returns, you can start with any amount. Use small initial investments to learn and build confidence.
After 30 days, continue monthly reviews, execute recommended rebalancing, and stick to your dollar-cost averaging schedule. Successful investing is about consistency and discipline, not constant activity.
Cryptocurrency investing doesn't require technical expertise, complicated processes, or endless time commitment. Token Metrics AI Indices make professional-grade crypto investing accessible to anyone willing to follow a simple, proven system.
You've learned what indices are, why they're perfect for beginners, and exactly how to get started in 30 minutes. You understand ongoing management, have answers to common concerns, and possess a 30-day action plan for success.
The only thing remaining is action. Every day you delay is a day you're not participating in one of the most significant wealth creation opportunities of our generation. Markets don't wait for perfect timing—they reward those who begin with imperfect action.
Your 30-minute journey to crypto investing starts with a single click. Sign up for Token Metrics' 7-day free trial today, explore the indices, and make your first investment following this guide. Your future self will thank you for taking action now rather than watching from the sidelines as others build life-changing wealth.
The tools are available. The guidance is clear. The opportunity is now. Begin your Token Metrics journey today.
Crypto is transitioning into a broadly bullish regime into 2026 as liquidity improves and adoption deepens.
Regulatory clarity is reshaping the classic four-year cycle, flows can arrive earlier and persist longer as institutions gain confidence.
Access and infrastructure continue to mature with ETFs, qualified custody, and faster L2 scaling that reduce frictions for new capital.
Real‑world integrations expand the surface area for crypto utility, which supports sustained participation across market phases.
This backdrop frames our scenario work for DOGE. The bands below reflect different total market sizes and DOGE's share dynamics.
Read the TLDR first, then dive into grades, catalysts, and risks.

How to read it: Each band blends cycle analogues and market-cap share math with TA guardrails. Base assumes steady adoption and neutral or positive macro. Moon layers in a liquidity boom. Bear assumes muted flows and tighter liquidity.
TM Agent baseline: Token Metrics lead metric, TM Grade, is 22.65 (Sell), and the trading signal is bearish, indicating short-term downward momentum. Price context: $DOGE is trading around $0.193, rank #9, down about 3.1% in 24 hours and roughly 16% over 30 days. Implication: upside likely requires a broader risk-on environment and renewed retail or celebrity-driven interest.
Live details: Dogecoin Token Details → https://app.tokenmetrics.com/en/dogecoin
• Scenario driven, outcomes hinge on total crypto market cap, higher liquidity and adoption lift the bands.
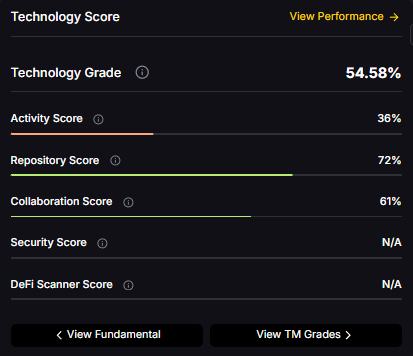
• Technology: Technology Grade 54.58% (Activity 36%, Repository 72%, Collaboration 61%, Security N/A, DeFi Scanner N/A).
• TM Agent gist: cautious long‑term stance until grades and momentum improve.
• Education only, not financial advice.
8T: 
16T: 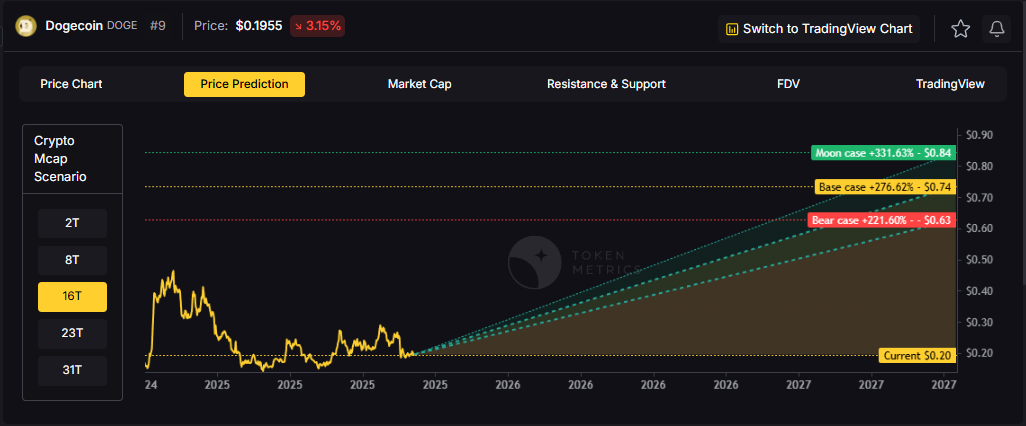
23T: 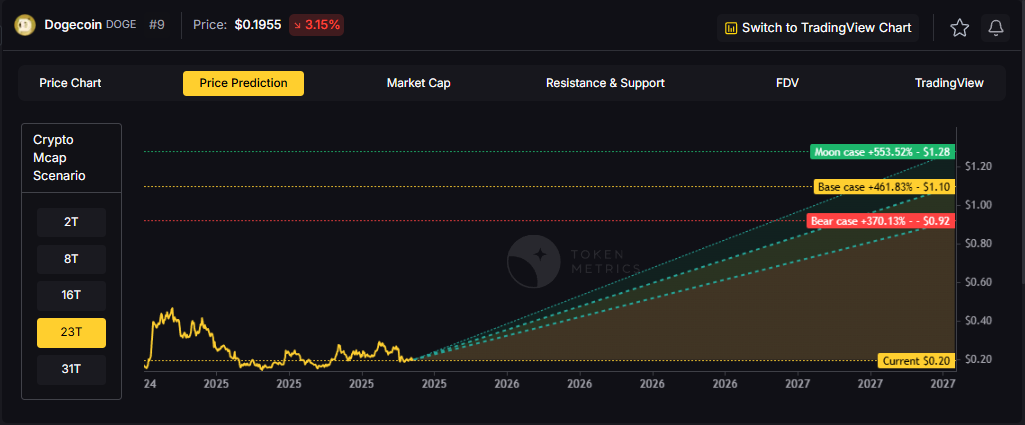
31T: 
Diversification matters. Dogecoin is compelling, yet concentrated bets can be volatile. Token Metrics Indices hold DOGE alongside the top one hundred tokens for broad exposure to leaders and emerging winners.
Our backtests indicate that owning the full market with diversified indices has historically outperformed both the total market and Bitcoin in many regimes due to diversification and rotation.
Dogecoin is a peer-to-peer cryptocurrency that began as a meme but has evolved into a widely recognized digital asset used for tipping, payments, and community-driven initiatives. It runs on its own blockchain with inflationary supply mechanics. The token’s liquidity and brand awareness create periodic speculative cycles, especially during broad risk-on phases.
Technology Snapshot from Token Metrics
Technology Grade: 54.58% (Activity 36%, Repository 72%, Collaboration 61%, Security N/A, DeFi Scanner N/A).
Catalysts That Skew Bullish
• Institutional and retail access expands with ETFs, listings, and integrations.
• Macro tailwinds from lower real rates and improving liquidity.
• Product or roadmap milestones such as upgrades, scaling, or partnerships.
Risks That Skew Bearish
• Macro risk-off from tightening or liquidity shocks.
• Regulatory actions or infrastructure outages.
• Concentration or validator economics and competitive displacement.
Special Offer — Token Metrics Advanced Plan with 20% Off
Unlock platform-wide intelligence on every major crypto asset. Use code ADVANCED20 at checkout for twenty percent off.
• AI powered ratings on thousands of tokens for traders and investors.
• Interactive TM AI Agent to ask any crypto question.
• Indices explorer to surface promising tokens and diversified baskets.
• Signal dashboards, backtests, and historical performance views.
• Watchlists, alerts, and portfolio tools to track what matters.
• Early feature access and enhanced research coverage.
Can DOGE reach $1.00?
Yes, multiple tiers imply levels above $1.00 by the 2027 horizon, including the 23T Base and all 31T scenarios. Not financial advice.
Is DOGE a good long-term investment?
Outcome depends on adoption, liquidity regime, competition, and supply dynamics. Diversify and size positions responsibly.

• Track live grades and signals: Token Details
• Join Indices Early Access
• Want exposure Buy DOGE on MEXC
Disclosure
Educational purposes only, not financial advice. Crypto is volatile, do your own research and manage risk.
.svg)


.png)
Token Metrics Media LLC is a regular publication of information, analysis, and commentary focused especially on blockchain technology and business, cryptocurrency, blockchain-based tokens, market trends, and trading strategies.
Token Metrics Media LLC does not provide individually tailored investment advice and does not take a subscriber’s or anyone’s personal circumstances into consideration when discussing investments; nor is Token Metrics Advisers LLC registered as an investment adviser or broker-dealer in any jurisdiction.
Information contained herein is not an offer or solicitation to buy, hold, or sell any security. The Token Metrics team has advised and invested in many blockchain companies. A complete list of their advisory roles and current holdings can be viewed here: https://tokenmetrics.com/disclosures.html/
Token Metrics Media LLC relies on information from various sources believed to be reliable, including clients and third parties, but cannot guarantee the accuracy and completeness of that information. Additionally, Token Metrics Media LLC does not provide tax advice, and investors are encouraged to consult with their personal tax advisors.
All investing involves risk, including the possible loss of money you invest, and past performance does not guarantee future performance. Ratings and price predictions are provided for informational and illustrative purposes, and may not reflect actual future performance.


%20Price%20Prediction%202025%2C%202030%20-%20Forecast%20Analysis.png)


.png)

%20Price%20Prediction%20.webp)


%20Price%20Prediction.webp)


%20Price%20Prediction%20Analysis%20-%20Can%20it%20Reach%20%24500%20in%20Future_.png)


