Text Link
Text Link
Text Link
Text Link
Text Link
Thank you! Your submission has been received!
Oops! Something went wrong while submitting the form.

Stop Guessing, Start Trading: The Token Metrics API Advantage

Announcements

Big news: We’re cranking up the heat on AI-driven crypto analytics with the launch of the Token Metrics API and our official SDK (Software Development Kit). This isn’t just an upgrade – it's a quantum leap, giving traders, hedge funds, developers, and institutions direct access to cutting-edge market intelligence, trading signals, and predictive analytics.

Crypto markets move fast, and having real-time, AI-powered insights can be the difference between catching the next big trend or getting left behind. Until now, traders and quants have been wrestling with scattered data, delayed reporting, and a lack of truly predictive analytics. Not anymore.

The Token Metrics API delivers 32+ high-performance endpoints packed with powerful AI-driven insights right into your lap, including:

  • Trading Signals: AI-driven buy/sell recommendations based on real-time market conditions.
  • Investor & Trader Grades: Our proprietary risk-adjusted scoring for assessing crypto assets.
  • Price Predictions: Machine learning-powered forecasts for multiple time frames.
  • Sentiment Analysis: Aggregated insights from social media, news, and market data.
  • Market Indicators: Advanced metrics, including correlation analysis, volatility trends, and macro-level market insights.

Getting started with the Token Metrics API is simple:

  1. Sign up at www.tokenmetrics.com/api
  2. Generate an API key and explore sample requests.
  3. Choose a tier–start with 50 free API calls/month, or stake TMAI tokens for premium access.
  4. Optionally–download the SDK, install it for your preferred programming language, and follow the provided setup guide.

At Token Metrics, we believe data should be decentralized, predictive, and actionable. 

The Token Metrics API & SDK bring next-gen AI-powered crypto intelligence to anyone looking to trade smarter, build better, and stay ahead of the curve. With our official SDK, developers can plug these insights into their own trading bots, dashboards, and research tools – no need to reinvent the wheel.

Research

Cardano (ADA) 2027 Price Targets: Token Metrics Scenarios

Token Metrics Team
7 min read

Market Context for Cardano: The Case for 2027

The Layer 1 competitive landscape is consolidating as markets recognize that specialization matters more than being a generic "Ethereum killer." Cardano positions itself in this multi-chain world with specific technical and ecosystem advantages. Infrastructure maturity around custody, bridges, and developer tools makes alternative L1s more accessible heading into 2026.

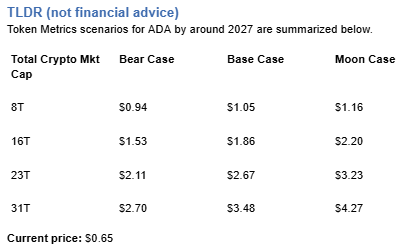
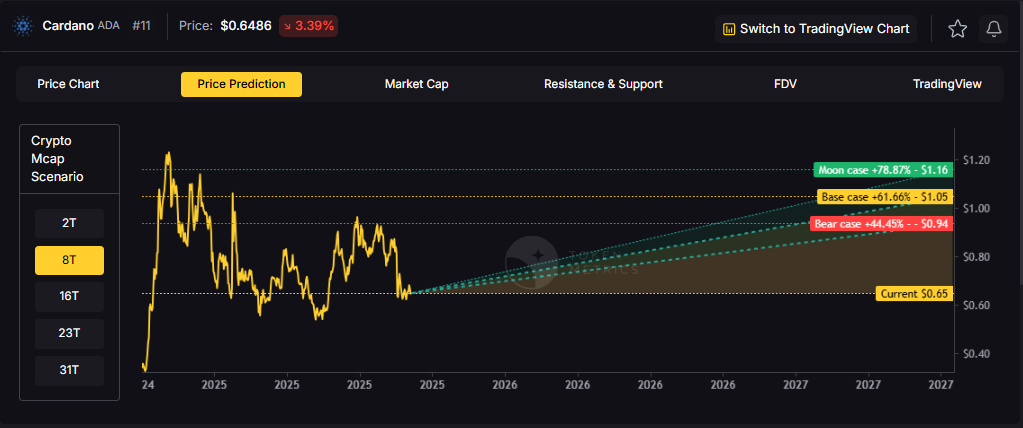
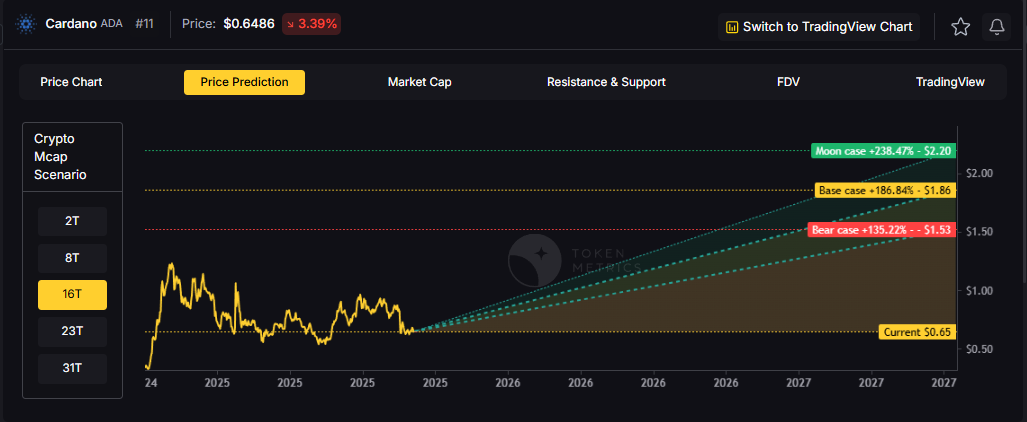
The scenario projections below map different market share outcomes for ADA across varying total crypto market sizes. Base cases assume Cardano maintains current ecosystem momentum, while moon scenarios factor in accelerated adoption and bear cases reflect increased competitive pressure.


Disclosure

Educational purposes only, not financial advice. Crypto is volatile, do your own research and manage risk.

How to read it: Each band blends cycle analogues and market-cap share math with TA guardrails. Base assumes steady adoption and neutral or positive macro. Moon layers in a liquidity boom. Bear assumes muted flows and tighter liquidity.

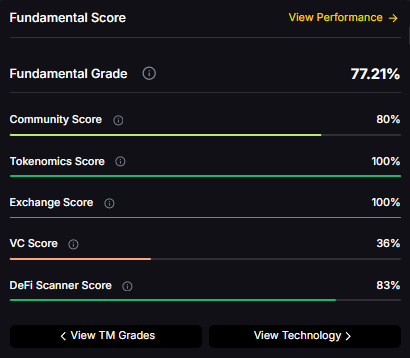
TM Agent baseline: Token Metrics lead metric for Cardano, cashtag $ADA, is a TM Grade of 29.72%, which translates to a Sell, and the trading signal is bearish, indicating short-term downward momentum. This combination means Token Metrics does not currently endorse $ADA as a long-term buy at current levels. A brief market context: Bitcoin's direction remains the dominant macro driver for smart contract platforms, so sustained upside for $ADA would require a broader crypto risk-on regime and improving fundamentals or developer activity for Cardano.

Live details: Cardano Token Details

Buy ADA on Gemini

Affiliate Disclosure: We may earn a commission from qualifying purchases made via this link, at no extra cost to you.

Key Takeaways

  • Scenario driven, outcomes hinge on total crypto market cap, higher liquidity and adoption lift the bands.
  • Fundamentals: Fundamental Grade 77.21% (Community 80%, Tokenomics 100%, Exchange 100%, VC 36%, DeFi Scanner 83%).
  • Technology: Technology Grade 81.80% (Activity 76%, Repository 72%, Collaboration 100%, Security N/A, DeFi Scanner 83%).
  • TM Agent gist: bearish short term, requires risk-on and improved fundamentals for sustained upside.
  • Education only, not financial advice.

Scenario Analysis

Token Metrics scenarios span four market cap tiers, each representing different levels of crypto market maturity and liquidity:

  • 8T: At an eight trillion dollar total crypto market cap, ADA projects to $0.94 in bear conditions, $1.05 in the base case, and $1.16 in bullish scenarios.
      
  • 16T: Doubling the market to sixteen trillion expands the range to $1.53 (bear), $1.86 (base), and $2.20 (moon).
      
  • 23T: At twenty-three trillion, the scenarios show $2.11, $2.67, and $3.23 respectively.
      
  • 31T: In the maximum liquidity scenario of thirty one trillion, ADA could reach $2.70 (bear), $3.48 (base), or $4.27 (moon).
      

Each tier assumes progressively stronger market conditions, with the base case reflecting steady growth and the moon case requiring sustained bull market dynamics.

Why Consider the Indices with Top-100 Exposure

Cardano represents one opportunity among hundreds in crypto markets. Token Metrics Indices bundle ADA with top one hundred assets for systematic exposure to the strongest projects. Single tokens face idiosyncratic risks that diversified baskets mitigate.

Historical index performance demonstrates the value of systematic diversification versus concentrated positions.

Join the early access list

What Is Cardano?

Cardano is a blockchain platform designed to support secure, scalable, and sustainable decentralized applications and smart contracts. It is known for its research-driven development approach, emphasizing peer-reviewed academic research and formal verification methods to ensure reliability and security. As a proof-of-stake Layer 1 blockchain, Cardano aims to offer energy efficiency and long-term scalability, positioning itself as a competitor to platforms like Ethereum. Its native token, ADA, is used for transactions, staking, and governance. Adoption is driven by technological rigor and ecosystem growth, though progress has been criticized for being slow compared to more agile competitors. Risks include execution delays, competition, and market volatility.

Cardano’s vision is to create a decentralized platform that enables sustainable and inclusive economic systems through advanced cryptography and scientific methodology. It aims to bridge gaps between traditional financial systems and blockchain technology, promoting accessibility and security for users globally.

Token Metrics AI Analysis

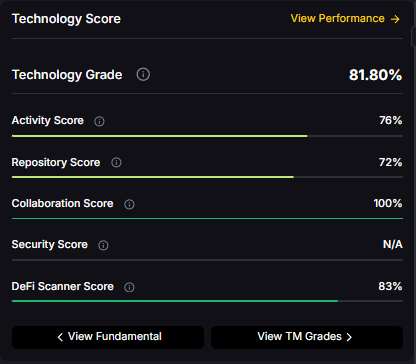
Token Metrics AI provides comprehensive context on Cardano's positioning and challenges.

  • Vision: Cardano’s vision is to create a decentralized platform that enables sustainable and inclusive economic systems through advanced cryptography and scientific methodology. It aims to bridge gaps between traditional financial systems and blockchain technology, promoting accessibility and security for users globally.
  • Problem: Many early blockchains face trade-offs between scalability, security, and energy efficiency. Cardano addresses the need for a more sustainable and formally verified blockchain infrastructure that can support complex applications without compromising decentralization or environmental impact. It targets inefficiencies in existing networks, particularly high energy use and lack of academic rigor in protocol design.
  • Solution: Cardano uses a proof-of-stake consensus algorithm called Ouroboros, which is mathematically verified for security and energy efficiency. The platform is built in layers, the settlement layer for ADA transactions and a separate computational layer for smart contracts, allowing for modular upgrades and improved scalability. It supports staking, governance, and decentralized applications, with an emphasis on formal methods to reduce vulnerabilities and ensure long-term viability.
  • Market Analysis: Cardano operates in the Layer 1 blockchain category, competing with Ethereum, Solana, and Avalanche. While not the market leader, it maintains a significant presence due to its academic foundation and global outreach, particularly in emerging economies. Adoption is influenced by developer activity, regulatory developments, and progress in ecosystem expansion. Its differentiator lies in its methodical, research-first approach, though this has led to slower deployment compared to peers. Market risks include technological delays, competition, and shifting investor sentiment. Broader adoption depends on sustained development, real-world use cases, and interoperability advancements.

Fundamental and Technology Snapshot from Token Metrics

  • Fundamental Grade: 77.21% (Community 80%, Tokenomics 100%, Exchange 100%, VC 36%, DeFi Scanner 83%).
      
  • Technology Grade: 81.80% (Activity 76%, Repository 72%, Collaboration 100%, Security N/A, DeFi Scanner 83%).
      

Catalysts That Skew Bullish

  • Institutional and retail access expands with ETFs, listings, and integrations.
  • Macro tailwinds from lower real rates and improving liquidity.
  • Product or roadmap milestones such as upgrades, scaling, or partnerships.

Risks That Skew Bearish

  • Macro risk-off from tightening or liquidity shocks.
  • Regulatory actions or infrastructure outages.
  • Concentration or validator economics and competitive displacement.

FAQs

Can ADA reach $4?

Based on the scenarios, ADA could reach $4 in the 31T moon case. The 31T tier projects $4.27 in the moon case. Not financial advice.

Can ADA 10x from current levels?

At current price of $0.65, a 10x would reach $6.50. This falls within none of the provided scenarios, which top out at $4.27 in the 31T moon case. Bear in mind that 10x returns require substantial market cap expansion. Not financial advice.

What price could ADA reach in the moon case?

Moon case projections range from $1.16 at 8T to $4.27 at 31T. These scenarios assume maximum liquidity expansion and strong Cardano adoption. Not financial advice.  
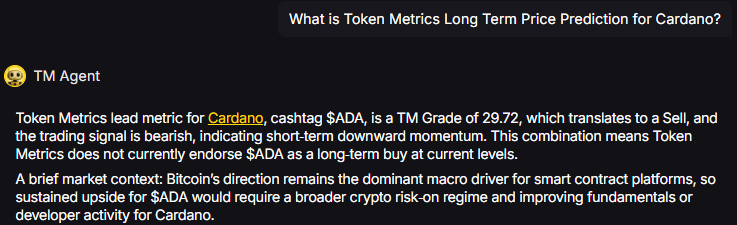
Next Steps

Disclosure

Educational purposes only, not financial advice. Crypto is volatile, do your own research and manage risk.

Research

Understanding X402: The Protocol Powering AI Agent Commerce

Token Metrics Team
4 min read

Introduction

The intersection of artificial intelligence and blockchain technology has produced numerous innovations, but few have the potential architectural significance of X402. This internet protocol, developed by Coinbase and Cloudflare, is positioning itself as the standard for machine-to-machine payments in an increasingly AI-driven digital economy.

What is X402?

X402 is an open protocol designed specifically for internet-native payments. To understand its significance, we need to consider how the internet operates through layered protocols:

  • HTTP/HTTPS: Powers web browsing
  • SMTP: Enables email communication
  • FTP: Facilitates file transfers
  • X402: Enables seamless payment transactions

While these protocols have existed for decades, X402 - despite being available for over ten years - has only recently found its primary use case: enabling autonomous AI agents to conduct commerce without human intervention.

The Problem X402 Solves

Traditional digital payments require several prerequisites that create friction for automated systems:

  1. Account Creation: Services typically require user registration with identity verification
  2. Subscription Models: Monthly or annual billing cycles don't align with usage-based AI operations
  3. Payment Processing Delays: Traditional payment rails operate on settlement cycles incompatible with real-time AI interactions
  4. Cross-Platform Complexity: Different services require different authentication and payment methods

AI agents operating autonomously need to:

  • Access services immediately without manual account setup
  • Pay per-request rather than commit to subscriptions
  • Transact in real-time with minimal latency
  • Maintain wallet functionality for financial operations

X402 addresses these challenges by creating a standardized payment layer that operates at the protocol level.

How X402 Works

The protocol functions as a real-time usage billing meter integrated directly into API requests. Here's a simplified workflow:

  1. AI Agent Request: An AI agent needs to access a service (e.g., data query, computation, API call)
  2. X402 Header: The request includes X402 payment information in the protocol header
  3. Service Verification: The service provider validates the payment capability
  4. Transaction Execution: Payment processes automatically, often in fractions of a penny
  5. Service Delivery: The requested service is provided immediately upon payment confirmation

This architecture enables transactions "up to a penny in under a second," according to protocol specifications.

Real-World Implementation: Token Metrics API

One of the most practical examples of X402 integration comes from Token Metrics, which has implemented X402 as a pay-per-call option for their cryptocurrency analytics API. This implementation demonstrates the protocol's value proposition in action.

Token Metrics X402 Pricing Structure:

  • Cost per API call: $0.017 - $0.068 (depending on endpoint complexity)
  • Commitment: None required
  • Monthly limits: Unlimited API calls
  • Rate limiting: Unlimited
  • Endpoint access: All endpoints available
  • Historical data: 3 months
  • Web sockets: 1 connection

Why This Matters:

This pricing model fundamentally differs from traditional API access:

Traditional Model:

  • Monthly subscription: $X per month (regardless of usage)
  • Commitment period required
  • Fixed tier with call limits
  • Manual account setup and payment processing

X402 Model:

  • Pay only for actual requests made
  • No upfront commitment or subscription
  • Scale usage dynamically
  • AI agents can access immediately without human intervention

For AI agents performing crypto market analysis, this creates significant efficiency:

  • An agent needing only 100 API calls per month pays ~$1.70-$6.80
  • Traditional subscription might cost $50-500 monthly regardless of usage
  • Agent can start making requests immediately without registration workflow
  • Usage scales perfectly with need

This implementation showcases X402's core value proposition: removing friction between autonomous systems and the services they consume.

Current Adoption Landscape

Analysis of X402scan data reveals the emerging adoption patterns:

Leading Facilitators:

  • Coinbase: Naturally leading adoption as a protocol co-creator
  • Token Metrics: Providing crypto data API access via X402
  • PayAI: Solana-focused payment facilitator gaining traction
  • OpenX402: Independent implementation showing growing transaction volume
  • Various AI Agents: Individual agents implementing X402 for service access

Transaction Metrics (30-day trends):

  • Coinbase maintains 4x transaction volume compared to competitors
  • PayAI experienced significant volatility with 8x price appreciation followed by sharp corrections
  • Slot-based gambling and AI analyst services showing unexpected adoption

Technical Integration Examples

Several platforms have implemented X402 functionality:

API Services:

Rather than requiring monthly subscriptions, API providers can charge per request. Token Metrics exemplifies this model - an AI agent queries their crypto analytics API, pays between $0.017-$0.068 via X402 depending on the endpoint, and receives the data - all within milliseconds. The agent accesses:

  • Unlimited API calls with no rate limiting
  • All available endpoints
  • 3 months of historical data
  • Real-time web socket connection

This eliminates the traditional friction of:

  • Creating accounts with email verification
  • Adding payment methods and billing information
  • Committing to monthly minimums
  • Managing subscription renewals

AI Agent Platforms:

  • Virtuals Protocol: Integrating X402 alongside proprietary solutions
  • AIXBT Labs: Enabling builders to integrate AI agents via X402
  • Eliza Framework: Supporting X402 for Solana-based agent development

Cross-Chain Implementation: X402 operates on multiple blockchain networks, with notable activity on Base (Coinbase's Layer 2) and Solana.

Market Implications

The emergence of X402 as a standard has created several market dynamics:

Narrative-Driven Speculation: Projects announcing X402 integration have experienced significant short-term price appreciation, suggesting market participants view the protocol as a value catalyst.

Infrastructure vs. Application Layer: The protocol creates a distinction between:

  • Infrastructure providers (payment facilitators, protocol implementations)
  • Application layer projects (AI agents, services utilizing X402)

Competitive Landscape: X402 faces competition from:

  • Proprietary payment solutions developed by individual platforms
  • Alternative blockchain-based payment protocols
  • Traditional API key and authentication systems

Use Cases Beyond AI Agents

While AI commerce represents the primary narrative, X402's architecture supports broader applications:

Data Services: As demonstrated by Token Metrics, any API provider can implement pay-per-request pricing. Applications include:

  • Financial market data
  • Weather information services
  • Geolocation and mapping APIs
  • Machine learning model inference
  • Database queries

Micropayment Content: Publishers could charge per-article access at fractional costs

IoT Device Transactions: Connected devices conducting autonomous commerce

Gaming Economies: Real-time, granular in-game transactions

Computing Resources: Pay-per-compute models for cloud services

The Economics of X402 for Service Providers

Token Metrics' implementation reveals the business model advantages for service providers:

Revenue Optimization:

  • Capture value from low-usage users who wouldn't commit to subscriptions
  • Eliminate customer acquisition friction
  • Reduce churn from users only needing occasional access
  • Enable price discovery through usage-based metrics

Market Access:

  • AI agents represent new customer segment unable to use traditional payment methods
  • Automated systems can discover and integrate services programmatically
  • Lower barrier to trial and adoption

Operational Efficiency:

  • Reduce customer support overhead (no subscription management)
  • Eliminate billing disputes and refund requests
  • Automatic revenue recognition per transaction

Challenges and Considerations

Several factors may impact X402 adoption:

Technical Complexity: Implementing X402 requires protocol-level integration, creating barriers for smaller developers.

Network Effects: Payment protocols succeed through widespread adoption. X402 competes with established systems and must reach critical mass.

Blockchain Dependency: Current implementations rely on blockchain networks for settlement, introducing:

  • Transaction costs (gas fees)
  • Network congestion risks
  • Cross-chain compatibility challenges

Pricing Discovery: As seen with Token Metrics' range of $0.017-$0.068 per call, establishing optimal pricing requires experimentation. Too high and traditional subscriptions become competitive; too low and revenue suffers.

Regulatory Uncertainty: Automated machine-to-machine payments operating across borders face unclear regulatory frameworks.

Market Maturity: The AI agent economy remains nascent. X402's long-term relevance depends on AI agents becoming standard economic actors.

Comparing X402 to Alternatives

Traditional API Keys with Subscriptions:

  • Advantage: Established, widely understood, predictable revenue
  • Disadvantage: Requires manual setup, subscription billing, slower onboarding, higher commitment barrier
  • Example: $50/month for 10,000 calls whether used or not

X402 Pay-Per-Call:

  • Advantage: Zero commitment, immediate access, perfect usage alignment, AI-agent friendly
  • Disadvantage: Variable costs, requires crypto infrastructure, emerging standard
  • Example: $0.017-$0.068 per actual call, unlimited potential usage

Cryptocurrency Direct Payments:

  • Advantage: Direct peer-to-peer value transfer
  • Disadvantage: Lacks standardization, higher complexity per transaction, no protocol-level support

Payment Processors (Stripe, PayPal):

  • Advantage: Robust infrastructure, legal compliance
  • Disadvantage: Minimum transaction amounts, settlement delays, geography restrictions

X402's differentiator lies in combining protocol-level standardization with crypto-native functionality optimized for automated systems, as demonstrated by Token Metrics' implementation where AI agents can make sub-dollar API calls without human intervention.

Development Resources

For developers interested in X402 integration:

Documentation: X402.well (protocol specifications)

Discovery Platforms: X402scan (transaction analytics), The Bazaar (application directory)

Integration Frameworks: Virtuals Protocol, Eliza (Solana), various Base implementations

Live Examples: Token Metrics API (tokenmetrics.com/api) demonstrates production X402 implementation

Several blockchain platforms now offer X402 integration libraries, lowering implementation barriers.

Market Performance Patterns

Projects associated with X402 have demonstrated characteristic patterns:

Phase 1 - Announcement: Initial price appreciation upon X402 integration news Phase 2 - Peak Attention: Maximum price when broader market attention focuses on X402 narrative Phase 3 - Stabilization: Price correction as attention shifts to next narrative

PayAI's trajectory exemplifies this pattern - rapid 8x appreciation followed by significant correction within days. This suggests X402-related assets behave as narrative-driven trading vehicles rather than fundamental value plays, at least in current market conditions.

However, service providers implementing X402 functionality (like Token Metrics) represent a different category - they're adding practical utility rather than speculating on the protocol itself.

Future Outlook

The protocol's trajectory depends on several factors:

AI Agent Proliferation: As AI agents become more autonomous and economically active, demand for payment infrastructure grows. Early implementations like Token Metrics' API access suggest practical demand exists.

Developer Adoption: Whether developers choose X402 over alternatives will determine market position. The simplicity of pay-per-call models may drive adoption.

Service Provider Economics: If providers like Token Metrics successfully monetize X402 access, other API services will follow. The ability to capture previously inaccessible low-usage customers creates compelling economics.

Institutional Support: Coinbase's backing provides credibility, but sustained development and promotion are necessary.

Regulatory Clarity: Clear frameworks for automated, cross-border machine transactions would reduce adoption friction.

Interoperability Standards: Success may require coordination with other emerging AI commerce protocols.

Conclusion

X402 represents an attempt to solve genuine infrastructure challenges in an AI-driven economy. The protocol's technical architecture addresses real friction points in machine-to-machine commerce, as demonstrated by Token Metrics' implementation of pay-per-call API access at $0.017-$0.068 per request with no commitments required.

This real-world deployment validates the core thesis: AI agents need frictionless, usage-based access to services without traditional account creation and subscription barriers. However, actual adoption remains in early stages, and the protocol faces competition from both traditional systems and alternative blockchain solutions.

For market participants, X402-related projects should be evaluated based on:

  • Actual transaction volume and usage metrics (not just speculation)
  • Developer adoption and integration depth
  • Real service implementations (like Token Metrics API)
  • Competitive positioning against alternatives
  • Sustainability beyond narrative-driven speculation

The protocol's long-term relevance will ultimately be determined by whether AI agents become significant economic actors requiring standardized payment infrastructure. While the technical foundation appears sound and early implementations show promise, market validation remains ongoing.

Key Takeaways:

  • X402 enables real-time, micropayment commerce for AI agents
  • Token Metrics API offers practical X402 implementation at $0.017-$0.068 per call with no commitments
  • Protocol operates at the internet infrastructure layer, similar to HTTP or SMTP
  • Pay-per-call model eliminates subscription friction and enables AI agent access
  • Current adoption concentrated on Base and Solana blockchains
  • Market interest has driven speculation in X402-related projects
  • Service provider implementations demonstrate real utility beyond speculation
  • Long-term success depends on AI agent economy maturation

This analysis is for informational purposes only. X402 adoption and associated project performance remain highly uncertain and subject to rapid change.

Research

Advanced Token Metrics Indices Strategies: Expert Techniques for Maximizing Returns and Minimizing Risk

Token Metrics Team
10 min read

Most crypto index content targets beginners, explaining basics and encouraging cautious entry. But what about experienced investors who already understand cryptocurrency fundamentals and want to optimize their index investing approach? How do sophisticated investors extract maximum value from Token Metrics indices while managing complex risk scenarios?

This advanced guide explores strategies beyond basic index investing, including multi-index portfolio construction, tactical allocation across market regimes, leveraging indices with complementary strategies, advanced rebalancing techniques, and sophisticated risk management frameworks that separate exceptional performance from merely good results.

If you've already invested in crypto indices for months or years and want to elevate your approach, this comprehensive guide provides the advanced techniques you need.

Understanding Your Investor Evolution

Before implementing advanced strategies, assess your current sophistication level and investment evolution honestly.

From Beginner to Intermediate

New investors focus on learning fundamentals, making initial allocations, and maintaining basic discipline. After 6-12 months, you've experienced market volatility, executed several rebalancing trades, and developed comfort with the investment process.

From Intermediate to Advanced

Advanced investors have navigated complete market cycles, understand their emotional responses to different conditions, built substantial positions, and seek optimization beyond standard approaches. You're no longer asking "should I invest in crypto?" but rather "how can I maximize risk-adjusted returns within my crypto allocation?"

This evolution takes 2-3 years typically—enough time to experience both bull and bear markets while building expertise through practical experience rather than just theoretical knowledge.

Multi-Index Portfolio Architecture: Beyond Single-Index Approaches

Sophisticated investors construct portfolios using multiple Token Metrics indices simultaneously, creating layered exposure serving different strategic purposes.

The Core-Satellite-Speculative Framework

Structure crypto index allocation across three distinct tiers:

  • Core Holdings (50-60%): Conservative and balanced indices providing stable, reliable exposure to established cryptocurrencies. This foundation ensures you capture broad market appreciation regardless of specific sector performance.
  • Satellite Positions (30-40%): Sector-specific and thematic indices targeting particular opportunities like DeFi, Layer-1 blockchains, or AI tokens. These tactical allocations allow overweighting sectors you believe will outperform without abandoning diversification.
  • Speculative Exposure (10-20%): Aggressive growth and memecoin indices pursuing maximum upside. This high-risk allocation captures explosive opportunities while limiting potential damage through position sizing.

This three-tier structure provides both stability and growth potential, allowing you to maintain conservative foundation while pursuing tactical opportunities aggressively.

Dynamic Tier Adjustment

Adjust tier allocations based on market conditions and personal conviction. During bull markets with high confidence, increase satellite and speculative allocations to 50% combined. During uncertain or bearish conditions, increase core holdings to 70-80%.

This dynamic adjustment allows capitalizing on opportunities while maintaining appropriate risk exposure for conditions.

Cross-Correlation Analysis

Advanced investors analyze correlation between different indices to maximize diversification benefits. Holding multiple indices with 0.9+ correlation provides minimal diversification—essentially concentrated exposure disguised as diversification.

Token Metrics provides correlation data allowing you to construct portfolios where indices complement rather than duplicate each other. Ideal multi-index portfolios combine indices with 0.3-0.7 correlations—related enough to benefit from crypto's overall growth but different enough to smooth returns.

Tactical Allocation Strategies: Rotating Capital Efficiently

Beyond static allocation, advanced investors rotate capital between indices based on market conditions, technical signals, and fundamental developments.

Momentum Rotation Strategy

Systematically rotate capital toward indices showing strongest recent performance while reducing exposure to lagging indices. This momentum approach captures trending sectors while avoiding those losing relative strength.

Implementation example:

  • Monthly, rank all indices by 90-day performance
  • Overweight top quartile indices by 5-10% above target allocation
  • Underweight bottom quartile indices by 5-10% below target allocation
  • Maintain overall crypto allocation within target range

This systematic rotation forces buying strength and trimming weakness—capitalizing on momentum while maintaining diversification.

Mean Reversion Approach

Alternatively, employ mean reversion strategy assuming sectors experiencing short-term underperformance will reverse. After significant declines, fundamentally sound sectors often present exceptional value.

Implementation approach:

  • Identify indices declining 30%+ while maintaining strong fundamentals
  • Increase allocation to these "temporarily distressed" indices
  • Hold through recovery, capturing outsized gains as sentiment improves
  • Take profits once indices return to top-quartile performance

Mean reversion requires strong conviction and patience but can generate exceptional returns buying sectors during temporary weakness.

Blended Momentum-Reversion Strategy

The most sophisticated approach blends momentum and mean reversion, applying momentum to aggressive/speculative indices while using mean reversion for core/conservative indices.

Aggressive indices benefit from momentum—riding hot sectors aggressively. Conservative indices benefit from mean reversion—buying quality assets during temporary weakness. This nuanced approach matches strategy to index characteristics rather than applying one-size-fits-all methodology.

Advanced Rebalancing Techniques

Standard rebalancing maintains target allocations. Advanced rebalancing employs sophisticated rules extracting additional alpha through strategic timing and execution.

Volatility-Triggered Rebalancing

Rather than rebalancing on fixed schedules, trigger rebalancing when volatility exceeds thresholds. During high volatility, prices deviate significantly from fundamentals—creating rebalancing opportunities.

Set volatility thresholds—when Bitcoin's 30-day volatility exceeds 80%, evaluate rebalancing opportunities. High volatility often accompanies market extremes offering excellent entry or exit points.

Threshold Rebalancing with Asymmetric Bands

Establish asymmetric rebalancing bands allowing winning positions to run further than standard symmetric approaches. If target allocation is 10% for an index, perhaps trigger rebalancing at 7% on downside but 15% on upside.

This asymmetry captures more upside from winning positions while preventing excessive losses from declining positions—improving overall risk-adjusted returns.

Tax-Optimized Rebalancing

Coordinate rebalancing with tax considerations, preferentially selling positions with losses to offset gains while rebalancing. During profitable years, delay rebalancing slightly to push tax liability into following year.

For positions held in taxable accounts, track cost basis precisely and prioritize selling highest-cost-basis lots first, minimizing capital gains taxes.

Leveraging Indices with Complementary Strategies

Advanced investors combine index investing with complementary strategies creating synergistic approaches exceeding either strategy alone.

The 70/30 Index-Plus Strategy

Allocate 70% to Token Metrics indices for professional management and diversification. Use remaining 30% for complementary strategies:

  • Individual High-Conviction Positions (15%): Based on deep personal research into specific projects you understand thoroughly
  • Yield Generation (10%): Stake index holdings or use DeFi protocols for additional yield on top of appreciation
  • Options/Derivatives (5%): For experienced traders, limited options strategies hedging downside or generating income

This approach maintains strong index foundation while allowing tactical strategies leveraging your specific expertise and risk tolerance.

Pair Trading with Indices

Advanced traders employ pair trading strategies—simultaneously longing one index while shorting another, profiting from relative performance regardless of overall market direction.

Example: If convinced DeFi will outperform Layer-1s short-term, overweight DeFi index while underweighting Layer-1 index relative to targets. If correct about relative performance, you profit even if both decline in absolute terms.

Pair trading requires sophistication and works best during sideways markets where directional movement is uncertain but relative performance differentials exist.

Stablecoin Yield Enhancement

During bear markets or consolidation, rotate portions of conservative index holdings temporarily into high-yield stablecoin strategies generating 5-15% APY. This preserves capital while generating income during periods when crypto appreciation stalls.

When bullish conditions return, rotate back into indices. This tactical approach maintains productivity during all market phases rather than passively holding through extended downturns.

Sophisticated Risk Management Frameworks

Advanced investors employ multi-layered risk management beyond basic position sizing and diversification.

Value-at-Risk (VaR) Monitoring

Calculate portfolio Value-at-Risk—the maximum expected loss over specific timeframe at given confidence level. If your 30-day VaR at 95% confidence is $50,000, you expect no more than $50,000 loss in 95% of 30-day periods.

Monitor VaR continuously and adjust allocations if risk exceeds tolerance. During volatile periods, VaR spikes significantly—this objective measurement informs whether to reduce exposure or maintain course based on predetermined risk budgets.

Conditional Value-at-Risk (CVaR)

Beyond VaR, calculate CVaR—expected loss in worst-case scenarios beyond VaR threshold. While VaR tells you typical maximum loss, CVaR reveals extreme scenario impacts.

High CVaR relative to VaR indicates "fat tail risk"—potential for catastrophic losses exceeding normal expectations. Adjust allocations to limit CVaR to acceptable levels relative to total portfolio.

Portfolio Stress Testing

Regularly stress test portfolio against historical extreme scenarios:

  • 2018 bear market (80%+ decline over 12 months)
  • March 2020 flash crash (50% decline in 48 hours)
  • 2022 Terra/LUNA collapse (complete failure of major protocol)
  • Exchange failure scenarios (losing access to 30% of holdings)

Understanding portfolio behavior during extreme stress prevents panic during actual crises—you've already mentally prepared for worst-case scenarios.

Dynamic Position Sizing

Rather than fixed allocations, adjust position sizes based on volatility—reducing exposure during high volatility periods and increasing during low volatility. This volatility-adjusted sizing maintains consistent risk exposure despite changing market conditions.

When volatility doubles, halve position sizes maintaining constant risk. When volatility halves, double position sizes maintaining returns potential. This dynamic approach optimizes risk-adjusted returns across volatility regimes.

Performance Attribution and Continuous Improvement

Advanced investors systematically analyze performance, understanding what's working and why.

Decomposing Returns

Break down portfolio returns into components:

  • Beta Returns: Returns from overall market exposure (what you'd get from simple buy-and-hold)
  • Index Selection Alpha: Returns from choosing outperforming indices over alternatives
  • Timing Alpha: Returns from tactical allocation adjustments and rebalancing timing
  • Cost Drag: Returns lost to fees, taxes, and trading costs

Understanding return sources reveals where your strategy adds value and where it doesn't, informing strategic refinements.

Keeping a Trading Journal

Maintain detailed journal documenting all strategic decisions:

  • What allocation changes did you make and why?
  • What was market context and your reasoning?
  • How did decisions perform over subsequent weeks/months?
  • What would you do differently with hindsight?
  • What patterns emerge across multiple decisions?

This systematic documentation transforms experience into learning, accelerating your development as sophisticated investor.

Quarterly Strategy Reviews

Conduct comprehensive quarterly reviews assessing:

  • Overall portfolio performance vs. benchmarks
  • Individual index performance and contribution to returns
  • Accuracy of tactical allocation decisions
  • Risk metrics (volatility, drawdowns, Sharpe ratio) vs. targets
  • Lessons learned and strategy adjustments for next quarter

These structured reviews create accountability and ensure continuous improvement rather than repeating mistakes.

Scaling Strategies as Portfolio Grows

As crypto holdings grow from thousands to hundreds of thousands or millions, strategies must evolve to match scale.

Institutional-Grade Custody

Once holdings exceed $100,000-$250,000, implement institutional-grade custody solutions. Multi-signature wallets requiring multiple approvals prevent single points of failure. Cold storage solutions protect against online threats. Insurance-backed custodians provide additional protection layers.

The sophistication required for securing substantial wealth exceeds most individuals' technical capabilities—professional custody solutions become essential.

Tax-Loss Harvesting at Scale

Large portfolios generate significant tax optimization opportunities. Systematic tax-loss harvesting across multiple indices, strategic timing of rebalancing to manage tax liability, and coordination with overall tax planning become crucial for preserving wealth.

Consider working with crypto-specialized tax advisors who understand optimal strategies for managing significant crypto positions.

Estate Planning Considerations

Substantial crypto holdings require estate planning ensuring wealth transfers efficiently to heirs. This includes secure key management protocols heirs can access, clear documentation of holdings and recovery processes, and potentially trusts or other vehicles optimizing estate taxes.

Without proper planning, crypto wealth can become inaccessible if something happens to you—proper preparation ensures your wealth serves intended purposes.

Conclusion: The Path to Mastery

Advanced crypto index investing transcends basic buy-and-hold approaches, incorporating sophisticated portfolio construction, tactical allocation, advanced risk management, and continuous performance optimization. These techniques separate exceptional investors from merely competent ones.

Token Metrics provides the foundation—comprehensive indices, sophisticated AI analysis, and professional management. Your advanced strategies built on this foundation determine ultimate success. The combination of institutional-grade tools and sophisticated personal strategies creates unprecedented wealth-building potential.

Mastery requires years of dedicated practice, continuous learning, and honest self-assessment. Each market cycle teaches new lessons. Each strategic decision provides data informing future choices. The journey from beginner to advanced investor never truly ends—markets evolve, requiring continuous adaptation.

Your advantage as advanced investor is recognizing that optimization matters as much as allocation. The difference between 25% and 35% annualized returns compounds into millions over decades. Small improvements in strategy, consistently applied, generate enormous long-term impact.

Begin implementing these advanced techniques systematically. Don't attempt everything simultaneously—choose 2-3 strategies matching your situation and expertise. Master those, then expand your toolkit progressively. Over time, you'll develop sophisticated approach rivaling professional fund managers.

Token Metrics provides the infrastructure. Your advanced strategies provide the edge. Together, they create framework for building generational wealth through crypto index investing.

Start your 7-day free trial today and begin applying these advanced strategies to accelerate your journey toward crypto investment mastery.

Recent Posts

No Item Found
Research

Token Metrics API vs. CoinGecko API: Which Crypto API Should You Choose in 2025?

Token Metrics Team
7 min

As the crypto ecosystem rapidly matures, developers, quant traders, and crypto-native startups are relying more than ever on high-quality APIs to build data-powered applications. Whether you're crafting a trading bot, developing a crypto research platform, or launching a GPT agent for market analysis, choosing the right API is critical.

Two names dominate the space in 2025: CoinGecko and Token Metrics. But while both offer access to market data, they serve fundamentally different purposes. CoinGecko is a trusted source for market-wide token listings and exchange metadata. Token Metrics, on the other hand, delivers AI-powered intelligence for predictive analytics and decision-making.

Let’s break down how they compare—and why the Token Metrics API is the superior choice for advanced, insight-driven builders.

🧠 AI Intelligence: Token Metrics Leads the Pack

At the core of Token Metrics is machine learning and natural language processing. It’s not just a data feed. It’s an AI that interprets the market.

Features exclusive to Token Metrics API:

  • Trader Grade (0–100) – Short-term momentum score based on volume, volatility, and technicals
  • Investor Grade (0–100) – Long-term asset quality score using fundamentals, community metrics, liquidity, and funding
  • Bullish/Bearish AI Signals – Real-time alerts based on over 80 weighted indicators
  • Sector-Based Smart Indices – Curated index sets grouped by theme (AI, DeFi, Gaming, RWA, etc.)
  • Sentiment Scores – Derived from social and news data using NLP
  • LLM-Friendly AI Reports – Structured, API-returned GPT summaries per token
  • Conversational Agent Access – GPT-based assistant that queries the API using natural language

In contrast, CoinGecko is primarily a token and exchange aggregator. It offers static data: price, volume, market cap, supply, etc. It’s incredibly useful for basic info—but it lacks context or predictive modeling.

Winner: Token Metrics — The only crypto API built for AI-native applications and intelligent automation.

🔍 Data Depth & Coverage

While CoinGecko covers more tokens and more exchanges, Token Metrics focuses on providing actionable insights rather than exhaustively listing everything.

Feature                                                   Token Metrics API                                    CoinGecko API

Real-time + historical OHLCV              ✅                                                          ✅

Trader/Investor Grades                        ✅ AI-powered                                     ❌

Exchange Aggregation                         ✅ (Used in indices, not exposed)     ✅

Sentiment & Social Scoring                  ✅ NLP-driven                                     ❌

AI Signals                                               ✅                                                         ❌

Token Fundamentals                            ✅ Summary via deepdive         ⚠️ Limited

                                                                        endpoint

NFT Market Data                                  ❌                                                          ✅

On-Chain Behavior                               ✅ Signals + Indices                   ⚠️ Pro-only (limited)

If you're building something analytics-heavy—especially trading or AI-driven—Token Metrics gives you depth, not just breadth.

Verdict: CoinGecko wins on broad metadata coverage. Token Metrics wins on intelligence and strategic utility.

🛠 Developer Experience

One of the biggest barriers in Web3 is getting devs from “idea” to “prototype” without friction. Token Metrics makes that easy.

Token Metrics API Includes:

  • SDKs for Python, Node.js, and Postman
  • Quick-start guides and GitHub sample projects
  • Integrated usage dashboard to track limits and history
  • Conversational agent to explore data interactively
  • Clear, logical endpoint structure across 21 data types

CoinGecko:

  • Simple REST API
  • JSON responses
  • Minimal docs
  • No SDKs
  • No built-in tooling (must build from scratch)

Winner: Token Metrics — Serious devs save hours with ready-to-go SDKs and utilities.

📊 Monitoring, Quotas & Support

CoinGecko Free Tier:

  • 10–30 requests/min
  • No API key needed
  • Public endpoints
  • No email support
  • Rate limiting enforced via IP

Token Metrics Free Tier:

  • 5,000 requests/month
  • 1 request/min
  • Full access to AI signals, grades, rankings
  • Telegram & email support
  • Upgrade paths to 20K–500K requests/month

While CoinGecko’s no-login access is beginner-friendly, Token Metrics offers far more power per call. With just a few queries, your app can determine which tokens are gaining momentum, which are losing steam, and how portfolios should be adjusted.

Winner: Token Metrics — Better for sustained usage, scaling, and production reliability.

💸 Pricing & Value

Plan Feature                CoinGecko Pro            Token Metrics API

Entry Price                  ~$150/month                $99/month

AI Grades & Signals            ❌                               ✅ 

Sentiment Analytics            ❌                               ✅

Sector Index Insights          ❌                               ✅

NLP Token Summaries       ❌                                ✅

Developer SDKs                  ❌                                ✅

Token-Based Discounts     ❌                                ✅ (up to 35% with $TMAI)

For what you pay, Token Metrics delivers quant models and intelligent signal streams — not just raw price.

Winner: Token Metrics — Cheaper entry, deeper value.

🧠 Use Cases Where Token Metrics API Shines

  • Trading Bots
    Use Trader Grade and Signal endpoints to enter/exit based on AI triggers.
  • GPT Agents
    Generate conversational answers for “What’s the best AI token this week?” using structured summaries.
  • Crypto Dashboards
    Power sortable, filtered token tables by grade, signal, or narrative.
  • Portfolio Rebalancers
    Track real-time signals for tokens held, flag risk zones, and show sector exposure.
  • LLM Plugins
    Build chat-based investment tools with explainability and score-based logic.

🧠 Final Verdict: CoinGecko for Info, Token Metrics for Intelligence

If you're building a crypto price tracker, NFT aggregator, or exchange overview site, CoinGecko is a solid foundation. It’s reliable, broad, and easy to get started.

But if your product needs to think, adapt, or help users make better decisions, then Token Metrics API is in another class entirely.

You're not just accessing data — you're integrating AI, machine learning, and predictive analytics into your app. That’s the difference between showing the market and understanding it.

🔗 Ready to Build Smarter?

  • ✅ 5,000 free API calls/month
  • 🤖 Trader & Investor Grades
  • 📊 Live Bull/Bear signals
  • 🧠 AI-powered summaries and GPT compatibility
  • ⚡ 21 endpoints + Python/JS SDKs

👉 Start with Token Metrics API

Research

Python Quick-Start with Token Metrics: The Ultimate Crypto Price API

Token Metrics Team
10 min

If you’re a Python developer looking to build smarter crypto apps, bots, or dashboards, you need two things: reliable data and AI-powered insights. The Token Metrics API gives you both. In this tutorial, we’ll show you how to quickly get started using Token Metrics as your Python crypto price API, including how to authenticate, install the SDK, and run your first request in minutes.

Whether you’re pulling live market data, integrating Trader Grades into your trading strategy, or backtesting with OHLCV data, this guide has you covered.

🚀 Quick Setup for Developers in a Hurry

Install the official Token Metrics Python SDK:

pip install tokenmetrics

Or if you prefer working with requests directly, no problem. We’ll show both methods below.

🔑 Step 1: Generate Your API Key

Before anything else, you’ll need a Token Metrics account.

  1. Go to app.tokenmetrics.com/en/api
  2. Log in and navigate to the API Keys Dashboard
  3. Click Generate API Key
  4. Name your key (e.g., “Development”, “Production”)
  5. Copy it immediately — keep it secret.

You can monitor usage, rate limits, and quotas right from the dashboard. Track each key’s status, last used date, and revoke access at any time.

📈 Step 2: Retrieve Crypto Prices in Python

Here’s a simple example to fetch the latest price data for Ethereum (ETH):

import requests

API_KEY = "YOUR_API_KEY"

headers = {"x-api-key": API_KEY}

url = "https://api.tokenmetrics.com/v2/daily-ohlcv?symbol=ETH&startDate=<YYYY-MM-DD>&endDate=<YYYY-MM-DD>"

response = requests.get(url, headers=headers)

data = response.json()

for candle in data['data']:

    print(f"Date: {candle['DATE']} | Close: ${candle['CLOSE']}")

You now have a working python crypto price API pipeline. Customize startDate or endDate to get specific range of historical data.

📊 Add AI-Powered Trader Grades

Token Metrics’ secret sauce is its AI-driven token ratings. Here’s how to access Trader Grades for ETH:

grade_url = "https://api.tokenmetrics.com/v2/trader-grades?symbol=ETH&limit=30d"

grades = requests.get(grade_url, headers=headers).json()['data']

for day in grades:

    print(f"{day['DATE']} — Trader Grade: {day['TA_GRADE']}")

Use this data to automate trading logic (e.g., enter trades when Grade > 85) or overlay on charts.

🔁 Combine Data for Backtesting

Want to test a strategy? Merge OHLCV and Trader Grades for any token:

import pandas as pd

ohlcv_df = pd.DataFrame(data['data'])

grades_df = pd.DataFrame(grades)

combined_df = pd.merge(ohlcv_df, grades_df, on="DATE")

print(combined_df.head())

Now you can run simulations, build analytics dashboards, or train your own models.

⚙️ Endpoint Coverage for Python Devs

  • /daily-ohlcv: Historical price data
  • /trader-grades: AI signal grades (0–100)
  • /trading-signals: Bullish/Bearish signals for short and long positions.
  • /sentiment: AI-modeled sentiment scores
  • /tmai: Ask questions in plain English

All endpoints return structured JSON and can be queried via requests, axios, or any modern client.

🧠 Developer Tips

  • Each request = 1 credit (tracked in real time)
  • Rate limits depend on your plan (Free = 1 req/min)
  • Use the API Usage Dashboard to monitor and optimize
  • Free plan = 5,000 calls/month — perfect for testing and building MVPs

💸 Bonus: Save 35% with $TMAI

You can reduce your API bill by up to 35% by staking and paying with Token Metrics’ native token, $TMAI. Available via the settings → payments page.

🌐 Final Thoughts

If you're searching for the best python crypto price API with more than just price data, Token Metrics is the ultimate choice. It combines market data with proprietary AI intelligence, trader/investor grades, sentiment scores, and backtest-ready endpoints—all in one platform.

✅ Real-time & historical data
✅ RESTful endpoints
✅ Python-ready SDKs and docs
✅ Free plan to start building today

Start building today → tokenmetrics.com/api

Looking for SDK docs? Explore the full Python Quick Start Guide

Research

Crypto API to Google Sheets in 5 Minutes: How to Use Token Metrics API with Apps Script

Token Metrics Team
6 min

If you're a trader, data analyst, or crypto enthusiast, chances are you've wanted to pull live crypto data directly into Google Sheets. Whether you're tracking prices, building custom dashboards, or backtesting strategies, having real-time data at your fingertips can give you an edge.

In this guide, we'll show you how to integrate the Token Metrics API — a powerful crypto API with free access to AI-powered signals — directly into Google Sheets in under 5 minutes using Google Apps Script.

📌 Why Use Google Sheets for Crypto Data?

Google Sheets is a flexible, cloud-based spreadsheet that:

  • Requires no coding to visualize data
  • Can be shared and updated in real time
  • Offers formulas, charts, and conditional formatting
  • Supports live API connections with Apps Script

When combined with the Token Metrics API, it becomes a powerful dashboard that updates live with Trader Grades, Bull/Bear Signals, historical OHLCV data, and more.

🚀 What Is Token Metrics API?

The Token Metrics API provides real-time and historical crypto data powered by AI. It includes:

  • Trader Grade: A score from 0 to 100 showing bullish/bearish potential
  • Bull/Bear Signal: A binary signal showing market direction
  • OHLCV: Open-High-Low-Close-Volume price history
  • Token Metadata: Symbol, name, category, market cap, and more

The best part? The free Basic Plan includes:

  • 5,000 API calls/month
  • Access to core endpoints
  • Hourly data refresh
  • No credit card required

👉 Sign up for free here

🛠️ What You’ll Need

  • A free Token Metrics API key
  • A Google account
  • Basic familiarity with Google Sheets

⚙️ How to Connect Token Metrics API to Google Sheets

Here’s how to get live AI-powered crypto data into Sheets using Google Apps Script.

🔑 Step 1: Generate Your API Key

  1. Visit: https://app.tokenmetrics.com/en/api
  2. Click “Generate API Key”
  3. Copy it — you’ll use this in the script

📄 Step 2: Create a New Google Sheet

  1. Go to Google Sheets
  2. Create a new spreadsheet
  3. Click Extensions > Apps Script

💻 Step 3: Paste This Apps Script

const TOKEN_METRICS_API_KEY = 'YOUR_API_KEY_HERE';

async function getTraderGrade(symbol) {

  const url = `https://api.tokenmetrics.com/v2/trader-grades?symbol=${symbol.toUpperCase()}`;

  const options = {

    method: 'GET',

    contentType: 'application/json',

    headers: {

      'accept': 'application/json',

      'x-api-key': TOKEN_METRICS_API_KEY,

    },

    muteHttpExceptions: true

  };


  const response = UrlFetchApp.fetch(url, options);

  const data = JSON.parse(response.getContentText() || "{}")


  if (data.success && data.data.length) {

    const coin = data.data[0];

    return [

      coin.TOKEN_NAME,

      coin.TOKEN_SYMBOL,

      coin.TA_GRADE,

      coin.DATE

    ];

  } else {

    return ['No data', '-', '-', '-'];

  }

}

async function getSheetData() {

  const sheet = SpreadsheetApp.getActiveSpreadsheet().getActiveSheet();

  const symbols = sheet.getRange('A2:A').getValues().flat().filter(Boolean);

  const results = [];

  results.push(['Name', 'Symbol', 'Trader Grade', 'Date']);

  for (const symbol of symbols) {

    if (symbol) {

      const row = await getTraderGrade(symbol);

      results.push(row);

    }

  }

  sheet.getRange(2, 2, results.length, results[0].length).setValues(results);

}

🧪 Step 4: Run the Script

  1. Replace 'YOUR_API_KEY_HERE' with your real API key.
  2. Save the project as TokenMetricsCryptoAPI.
  3. In your sheet, enter a list of symbols (e.g., BTC, ETH, SOL) in Column A.
  4. Go to the script editor and run getSheetData() from the dropdown menu.

Note: The first time, Google will ask for permission to access the script.

✅ Step 5: View Your Live Data

After the script runs, you’ll see:

  • Coin name and symbol
  • Trader Grade (0–100)
  • Timestamp

You can now:

  • Sort by Trader Grade
  • Add charts and pivot tables
  • Schedule automatic updates with triggers (e.g., every hour)

🧠 Why Token Metrics API Is Ideal for Google Sheets Users

Unlike basic price APIs, Token Metrics offers AI-driven metrics that help you:

  • Anticipate price action before it happens
  • Build signal-based dashboards or alerts
  • Validate strategies against historical signals
  • Keep your data fresh with hourly updates

And all of this starts for free.

🏗️ Next Steps: Expand Your Sheet

Here’s what else you can build:

  • A portfolio tracker that pulls your top coins’ grades
  • A sentiment dashboard using historical OHLCV
  • A custom screener that filters coins by Trader Grade > 80
  • A Telegram alert system triggered by Sheets + Apps Script + Webhooks

You can also upgrade to the Advanced Plan to unlock 21 endpoints including:

  • Investor Grades
  • Smart Indices
  • Sentiment Metrics
  • Quantitative AI reports
  • 60x API speed

🔐 Security Tip

Never share your API key in a public Google Sheet. Use script-level access and keep the sheet private unless required.

🧩 How-To Schema Markup (for SEO)

{

  "@context": "https://schema.org",

  "@type": "HowTo",

  "name": "Crypto API to Google Sheets in 5 Minutes",

  "description": "Learn how to connect the Token Metrics crypto API to Google Sheets using Google Apps Script and get real-time AI-powered signals and prices.",

  "totalTime": "PT5M",

  "supply": [

    {

      "@type": "HowToSupply",

      "name": "Google Sheets"

    },

    {

      "@type": "HowToSupply",

      "name": "Token Metrics API Key"

    }

  ],

  "tool": [

    {

      "@type": "HowToTool",

      "name": "Google Apps Script"

    }

  ],

  "step": [

    {

      "@type": "HowToStep",

      "name": "Get Your API Key",

      "text": "Sign up at Token Metrics and generate your API key from the API dashboard."

    },

    {

      "@type": "HowToStep",

      "name": "Create a New Google Sheet",

      "text": "Open a new sheet and list crypto symbols in column A."

    },

    {

      "@type": "HowToStep",

      "name": "Add Apps Script",

      "text": "Go to Extensions > Apps Script and paste the provided code, replacing your API key."

    },

    {

      "@type": "HowToStep",

      "name": "Run the Script",

      "text": "Execute the getSheetData function to pull data into the sheet."

    }

  ]

}

✍️ Final Thoughts

If you're serious about crypto trading or app development, integrating live market signals into your workflow can be a game-changer. With the Token Metrics API, you can get institutional-grade AI signals — right inside Google Sheets.

This setup is simple, fast, and completely free to start. Try it today and unlock a smarter way to trade and build in crypto.

👉 Get Your API Key & Start for Free

Announcements

🚀Put Your $TMAI to Work: Daily Rewards, No Locks, Up To 200% APR.

Token Metrics Team
5 min

Liquidity farming just got a major upgrade. Token Metrics AI ($TMAI) has launched its first liquidity incentive campaign on Merk — and it’s designed for yield hunters looking to earn fast, with no lockups, no gimmicks, and real rewards from Day 1.

📅 Campaign Details

  • Duration: June 5 – June 19, 2025
  • Rewards Begin: 17:00 UTC / 1:00 PM ET
  • Total TMAI Committed: 38 million+ $TMAI
  • No Lockups: Enter or exit at any time
  • APR Potential: Up to 200%

For two weeks, liquidity providers can earn high daily rewards across three different pools. All rewards are paid in $TMAI and distributed continuously — block by block — through the Merkl platform.

💧 Where to Earn – The Pools (as of June 5, 17:00 UTC)

Pool                                                    Starting APR %               Total Rewards (14 days)                Current TVL

Aerodrome WETH–TMAI        150%                                16.79M TMAI (~$11,000)                   $86,400

Uniswap v3 USDC–TMAI        200%                                14.92M TMAI (~$9,800)                    $19,900

Balancer 95/5 WETH–TMAI    200%                                5.60M TMAI (~$3,700)                       $9,500

These pools are live and actively paying rewards. APR rates aren’t displayed on Merkl until the first 24 hours of data are available — but early providers will already be earning.

🧠 Why This Campaign Stands Out

1. Turbo Rewards for a Short Time

This isn’t a slow-drip farm. The TMAI Merkl campaign is designed to reward action-takers. For the first few days, yields are especially high — thanks to low TVL and full daily reward distribution.

2. No Lockups or Waiting Periods

You can provide liquidity and withdraw it anytime — even the same day. There are no lockups, no vesting, and no delayed payout mechanics. All rewards accrue automatically and are claimable through Merkl.

3. Choose Your Risk Profile

You get to pick your exposure.

  • Want ETH upside? Stake in Aerodrome or Balancer.
  • Prefer stablecoin stability? Go with the Uniswap v3 USDC–TMAI pool.

4. Influence the Future of TMAI Yield Farming

This campaign isn’t just about yield — it’s a test. If enough users participate and volume grows, the Token Metrics Treasury will consider extending liquidity rewards into Q3 and beyond. That means more TMAI emissions, longer timelines, and consistent passive income opportunities for LPs.

5. Built for Transparency and Speed

Rewards are distributed via Merkl by Angle Labs, a transparent, gas-efficient platform for programmable liquidity mining. You can see the exact rewards, TVL, wallet counts, and pool analytics at any time.

🔧 How to Get Started

Getting started is simple. You only need a crypto wallet, some $TMAI, and a matching asset (either WETH or USDC, depending on the pool).

Step-by-step:

  1. Pick a pool:
    Choose from Aerodrome, Uniswap v3, or Balancer depending on your risk appetite and asset preference.

  2. Provide liquidity:
    Head to the Merkl link for your pool, deposit both assets, and your position is live immediately.

  3. Track your earnings:
    Watch TMAI accumulate daily in your Merkl dashboard. You can claim rewards at any time.

  4. Withdraw when you want:
    Since there are no lockups, you can remove your liquidity whenever you choose — rewards stop the moment liquidity is pulled.

🎯 Final Thoughts

This is a rare opportunity to earn serious rewards in a short amount of time. Whether you’re new to liquidity mining or a DeFi veteran, the TMAI Merkl campaign is built for speed, flexibility, and transparency.

You’re still early. The best yields happen in the first days, before TVL rises and APR stabilizes. Dive in now and maximize your returns while the turbo phase is still on.

👉 Join the Pools and Start Earning

Announcements

Token Metrics API Joins RapidAPI: The Fastest Way to Add AI-Grade Crypto Data to Your App

Token Metrics Team
5 min

The hunt for a dependable Crypto API normally ends in a graveyard of half-maintained GitHub repos, flaky RPC endpoints, and expensive enterprise feeds that hide the true cost behind a sales call. Developers waste days wiring those sources together, only to learn that one fails during a market spike or that data schemas never quite align. The result? Bots mis-fire, dashboards drift out of sync, and growth stalls while engineers chase yet another “price feed.”

That headache stops today. Token Metrics API, the same engine that powers more than 70 000 users on the Token Metrics analytics platform, is now live on RapidAPI—the largest marketplace of public APIs with more than four million developers. One search, one click, and you get an AI-grade Crypto API with institutional reliability and a 99.99 % uptime SLA.

Why RapidAPI + Token Metrics API Matters

  • Native developer workflow – No separate billing portal, OAuth flow, or SDK hunt. Click “Subscribe,” pick the Free plan, and RapidAPI instantly generates a key.

  • Single playground – Run test calls in-browser and copy snippets in cURL, Python, Node, Go, or Rust without leaving the listing.

  • Auto-scale billing – When usage grows, RapidAPI handles metering and invoices. You focus on product, not procurement.

What Makes the Token Metrics Crypto API Different?

  1. Twenty-one production endpoints

    Live & historical prices, hourly and daily OHLCV, proprietary Trader & Investor Grades, on-chain and social sentiment, AI-curated sector indices, plus deep-dive AI reports that summarise fundamentals, code health, and tokenomics.

  2. AI signals that win

    Over the last 24 months, more than 70 % of our bull/bear signals outperformed simple buy-and-hold. The API delivers that same alpha in flat JSON.

  3. Institutional reliability

    99.99 % uptime, public status page, and automatic caching for hot endpoints keep latency low even on volatile days.

Three-Step Quick Start

  1. Search “Token Metrics API” on RapidAPI and click Subscribe.
  2. Select the Free plan (5 000 calls / month, 20 request / min) and copy your key.
  3. Test:

bash

CopyEdit

curl -H "X-RapidAPI-Key: YOUR_KEY" \

     -H "X-RapidAPI-Host: tokenmetrics.p.rapidapi.com" \

     https://tokenmetrics.p.rapidapi.com/v2/trader-grades?symbol=BTC

The response returns Bitcoin’s live Trader Grade (0-100) and bull/bear flag. Swap BTC for any asset or explore /indices, /sentiment, and /ai-reports.

Real-World Use Cases

Use case

How developers apply the Token Metrics API

Automated trading bots

Rotate allocations when Trader Grade > 85 or sentiment flips bear.

Portfolio dashboards

Pull index weights, grades, and live prices in a single call for instant UI load.

Research terminals

Inject AI Reports into Notion/Airtable for analyst workflows.

No-code apps

Combine Zapier webhooks with RapidAPI to display live sentiment without code.

Early adopters report 30 % faster build times because they no longer reconcile five data feeds.

Pricing That Scales

  • Free – 5 000 calls, 30-day history.
  • Advanced – 20 000 calls, 3-month history.
  • Premium – 100 000 calls, 3-year history.
  • VIP – 500 000 calls, unlimited history.

Overages start at $0.005 per call.

Ready to Build?

• RapidAPI listing: https://rapidapi.com/tm-ai/api/token-metrics 

https://rapidapi.com/token-metrics-token-metrics-default/api/token-metrics-api1
• Developer docs: https://developers.tokenmetrics.com
• Support Slack: https://join.slack.com/t/tokenmetrics-devs/shared_invite/…

Spin up your key, ship your bot, and let us know what you create—top projects earn API credits and a Twitter shout-out.

Announcements

Crypto MCP Server: Token Metrics Brings One-Key Data to OpenAI, Claude, Cursor & Windsurf

Token Metrics Team
5 min

The modern crypto stack is a jungle of AI agents: IDE copilots that finish code, desktop assistants that summarise white-papers, CLI tools that back-test strategies, and slide generators that turn metrics into pitch decks. Each tool speaks a different protocol, so developers juggle multiple keys and mismatched JSON every time they query a Crypto API. That fragmentation slows innovation and creates silent data drift.

To fix it, we built the Token Metrics Crypto MCP Server—a lightweight gateway that unifies every tool around a single Multi-Client Crypto API. MCP (Multi-Client Protocol) sits in front of the Token Metrics API and translates requests into one canonical schema. Paste your key once, and a growing suite of clients speaks the same crypto language:

  • OpenAI Agents SDK – build ChatGPT-style agents with live grades
  • Claude Desktop – natural-language research powered by real-time metrics
  • Cursor / Windsurf IDE – in-editor instant queries
  • Raycast, Tome, VS Code, Cline and more

Why a Crypto MCP Server Beats Separate APIs

Consistency – Claude’s grade equals Windsurf’s grade.
One-time auth – store one key; clients handle headers automatically.
Faster prototyping – build in Cursor, test in Windsurf, present in Tome without rewriting queries.
Lower cost – shared quota plus $TMAI discount across all tools.

Getting Started

  1. Sign up for the Free plan (5 000 calls/month) and get your key: https://app.tokenmetrics.com/en/api
  2. Click the client you want to setup mcp for: smithery.ai/server/@token-metrics/mcp or https://modelcontextprotocol.io/clients

Your LLM assistant, IDE, CLI, and slide deck now share a single, reliable crypto brain. Copy your key, point to MCP, and start building the next generation of autonomous finance.

How Teams Use the Multi-Client Crypto API

  • Research to Execution – Analysts ask Claude for “Top 5 DeFi tokens with improving Trader Grades.” Cursor fetches code snippets; Windsurf trades the shortlist—all on identical data.
  • DevRel Demos – Share a single GitHub repo with instructions for Cursor, VS Code, and CLI; workshop attendees choose their favorite environment and still hit the same endpoints.
  • Compliance Dashboards – Tome auto-refreshes index allocations every morning, ensuring slide decks stay current without manual updates

Pricing, Rate Limits, and $TMAI

The Crypto MCP Server follows the core Token Metrics API plans: Free, Advanced, Premium, and VIP up to 500 000 calls/month and 600 req/min. Paying or staking $TMAI applies the familiar 10 % pay-in bonus plus up to 25 % staking rebate—35 % total savings. No new SKU, no hidden fee.

Build Once, Query Everywhere

The Token Metrics Crypto MCP Server turns seven scattered tools into one cohesive development environment. Your LLM assistant, IDE, CLI, and slideshow app now read from the same real-time ledger. Copy your key, point to MCP, and start building the next generation of autonomous finance.

• Github repo: https://github.com/token-metrics/mcp

👉 Ready to build? Grab your key from https://app.tokenmetrics.com/en/api

👉 Join Token Metrics API Telegram group  

Step-by-step client guides at smithery.ai/server/@token-metrics/mcp or https://modelcontextprotocol.io/clients — everything you need to wire Token Metrics MCP into Open AI, Claude, Cursor, Windsurf and more.

Research

Unlock Smarter Trades: Explore the All-New Token Metrics Market Page for Crypto Signal Discovery

Token Metrics Team
4 min

In the fast-paced world of crypto trading, timing is everything. One small delay can mean missing out on a breakout — or getting caught in a dump. That’s why we’ve completely redesigned the Token Metrics Market Page for 2025, bringing users faster access to the most accurate crypto trading signals powered by AI, on-chain analysis, and proprietary data science models.

This isn’t just a design refresh. It’s a full rethinking of how traders interact with data — with one goal in mind: make smarter trades faster.

Why Interface Matters in 2025’s Data-Driven Crypto Market

Crypto has matured. In 2025, the market is no longer driven by just hype or tweets. The best traders are using quantitative tools, AI signals, and real-time on-chain intelligence to stay ahead. And the Token Metrics Market Page is now built to meet that standard.

Gone are the days of switching between ten different platforms to get a complete view of a token. With the new Market Page, everything you need to make a data-backed trading decision is at your fingertips — no noise, no fluff, just high-signal information.

What’s New: Market Page Features That Give You an Edge

🔥 High-Performing Signals Front and Center

At the top of the redesigned Market Page, we’ve surfaced the week’s most compelling bullish and bearish crypto signals. These aren’t just based on price action — they’re curated using a powerful blend of AI, technical analysis, momentum trends, and on-chain activity.

Take Launch Coin week. It’s been topping the bullish charts due to a sharp uptick in volume and social traction — even though the price has begun to stabilize. Our platform caught the early signal, helping users ride the wave before it showed up on mainstream crypto news feeds.

Every token featured here has passed through our proprietary signal engine, which incorporates:

  • Token Metrics Trader Grade (short-term technical outlook)
  • Investor Grade (longer-term fundamentals)
  • Volume & Liquidity metrics
  • Community sentiment and social velocity
  • Exchange and VC backing

The result? You don’t just know what’s pumping — you know why it’s moving, and whether it’s likely to hold.

🧠 Smarter Filtering and Custom Dashboards

Want to isolate tokens in the DeFi space? Looking for only high-grade bullish signals on Ethereum or Solana? With new filtering options by sector, signal strength, and chain, you can zero in on the exact types of trades you're looking for — whether you're a casual trader or running a portfolio strategy.

This personalized dashboard experience brings hedge-fund-grade analytics to your fingertips, democratizing access to sophisticated data tools for retail and pro traders alike.

📉 Data Visuals at a Glance

Every token card on the Market Page now comes with a visual snapshot showing:

  • Recent price movement
  • Momentum trends
  • Short-term vs. long-term grades
  • Signal performance over time

No need to deep-dive into separate pages unless you want to — Token Metrics puts quick visual context right where you need it to reduce friction and increase speed.

📱 Mobile-Optimized for Trading on the Go

We know many users monitor the market and execute trades from their phone. That’s why we’ve ensured the entire Market Page is fully mobile-responsive, optimized for fast swipes, taps, and decisions without losing any key insights.

With Token Metrics, your next trade idea can start while you’re commuting, grabbing coffee, or even mid-conversation at a crypto meetup.

The Token Metrics Advantage: AI-Powered Crypto Trading in Real-Time

This redesign is just one piece of the broader Token Metrics vision — making AI-driven crypto trading accessible to everyone.

If you’re serious about catching the next 10x altcoin, surviving market crashes, or just improving your signal-to-noise ratio, here’s why thousands of crypto traders choose Token Metrics:

  • Real-time trading signals for 6,000+ tokens
  • AI-generated Trader and Investor Grades
  • Market signals backed by 80+ data points
  • Daily updates from our deep-dive research AI
  • Integrated with self-custody workflows
  • Trusted by analysts, devs, and hedge funds

Our users aren’t just following the market — they’re leading it.

Use Case: How Traders Are Winning with Token Metrics

One of our users recently shared how they caught a 47% pump on an obscure DePIN token by acting on a Buy Signal that showed up in the Market Page’s Bullish section three days before the breakout. The token had minimal social chatter at the time, but our models flagged rising volume, strong fundamentals, and a breakout formation building on the technical side.

Stories like this are becoming common. With every new feature and dataset added to Token Metrics, users are getting smarter, faster, and more confident in their crypto trades.

What’s Next for the Market Page

This is just the beginning. Coming soon to the Market Page:

  • 💡 Auto-alerts based on your saved filters
  • 📊 Historical signal performance analytics
  • 🛠️ Integrations with our API for power users
  • 🧵 Narrative filters based on trending themes (AI, DeFi, Memes, RWA, etc.)

We’re building the most intelligent crypto trading assistant on the web — and the new Market Page is your window into it.

Final Thoughts: Don’t Just React — Predict

In crypto, being early is everything. But with thousands of tokens and hundreds of narratives, knowing where to look can be overwhelming.

The redesigned Token Metrics Market Page removes the guesswork.

By giving you AI-powered insights, real-time signals, and actionable visualizations, it transforms your screen into a decision-making engine. Whether you’re day trading or managing a long-term altcoin portfolio, the right data — surfaced the right way — gives you the edge you need.

Visit the new Market Page today, and see why 2025’s smartest crypto traders are making Token Metrics their go-to tool for navigating this volatile, opportunity-packed market.

Ready to Trade Smarter?

Explore the new Market Page

Want the signal before the crowd?

Try Token Metrics free and get instant access to:

  • AI Signals
  • Investor and Trader Grades
  • Market Timing Tools
  • Bullish and Bearish Alerts

Because in crypto, data is the new alpha — and Token Metrics helps you unlock it.

Research

Launchcoin, Hype Cycles, and the Power of Crypto Trading with Token Metrics

Token Metrics Team
4 min

In the fast-moving world of crypto, narratives can generate staggering returns — but they can also evaporate just as quickly. Launch Coin, one of 2025’s most talked-about tokens, is a perfect case study in how trends emerge, peak, and fade — and why having the right data matters more than ever for successful trading.

At its height, Launch Coin delivered an eye-popping 35x return, capturing the full attention of retail traders, influencers, and crypto-native venture funds alike. The premise was simple but powerful: users could launch a token simply by replying to a tweet. This radically lowered the barrier to token creation and empowered anyone with an idea to tokenize it — instantly.

But by late May, the token had corrected to 20x — still strong on paper, but signaling a definitive cooling of momentum. And with it, the social token narrative that once set Crypto Twitter on fire appears to be losing its grip. As traders reevaluate their exposure, this moment offers a broader lesson: the ability to detect the peak of a narrative is as important as catching its beginning.

The Rise of Launch Coin: What Made It Explode

Launch Coin arrived at just the right time.

  • The market was hungry for new ideas.
  • Token infrastructure had become easier than ever.
  • Crypto influencers were eager to test new engagement mechanics.

The combination of virality, accessibility, and novelty made Launchcoin irresistible. Its core feature — allowing users to tokenize ideas from social media — felt like the next evolution of community-building and creator monetization.

But more than the technology, it was the narrative that did the heavy lifting. In crypto, narratives are often the fuel that turns good ideas into short-term trading frenzies. And in Launchcoin’s case, the market piled in, creating the kind of momentum rarely seen outside meme coin season.

What the Drop to 20x Really Means

From a pure return standpoint, Launch Coin is still a winner. But price alone doesn’t tell the full story. The sharp retrace from its peak indicates a critical shift: interest is waning, even if believers remain vocal.

This kind of transition is common in crypto. We’ve seen it before:

  • Meme tokens like $DOGE and $PEPE exploding, then cooling.
  • NFT profile pictures dominating in 2021, then fading in 2022.
  • Yield farming innovations gaining traction, only to collapse under unsustainable tokenomics.

Launchcoin fits the same pattern. The rapid rise of token creation without friction led to a flood of low-quality projects, diluting excitement and prompting serious traders to rotate out. Today’s pullback reflects narrative fatigue — a critical turning point for traders.

Lessons from the Launch Coin Cycle — and How Token Metrics Helps You Trade Smarter

1. Narratives are powerful — but data wins trades

Many traders chase stories. But seasoned traders look for signals — the objective indicators that show when momentum is truly shifting. Token Metrics helps you cut through the noise by surfacing:

  • Trader Grade — based on short-term technicals, momentum, and volatility
  • Investor Grade — based on long-term fundamentals like liquidity, VC presence, and on-chain activity
  • Bullish/Bearish AI Signals — built on 80+ real-time data points

For Launch Coin, Token Metrics flagged the beginning of signal deterioration weeks before the broader market realized. While social media was still buzzing, our models showed declining momentum, weaker volume, and slowing engagement — early warnings for savvy traders.

2. You must be agile when trading narrative-based tokens

One of the biggest challenges in crypto trading is knowing when to rotate. Launch Coin’s decline didn’t happen in a vacuum. As capital exited social tokens, we saw attention shift toward AI tokens, DeFi lending protocols, and real-world asset platforms.

Token Metrics tracks narrative shifts in real time. On our Market Page, users can filter trending bullish signals by:

  • Sector (AI, DeFi, Memes, RWAs)
  • Chain (Ethereum, Solana, Base)
  • Signal strength
  • Market cap tiers (Large-cap, Mid-cap, Degen)

This makes it easier to identify early movers, reposition capital, and avoid getting trapped in narratives that are losing steam.

3. Tokens tied to platforms, not just hype, are more sustainable

Another insight: many of the most successful long-term tokens are backed by infrastructure, not just ideas. Ethereum, Solana, Chainlink — these all power ecosystems. Launchcoin’s challenge is whether it can evolve from a fun gimmick into a lasting layer for social token infrastructure.

Token Metrics’ Investor Grade can help you evaluate this potential by analyzing:

  • Ecosystem traction
  • Developer activity
  • Exchange listings
  • Backer profiles
  • Community strength

By weighting these factors into its grade, Token Metrics helps users avoid being misled by short-term excitement and focus instead on tokens with staying power.

Trading with Token Metrics: A Competitive Edge in Every Market Cycle

The Launchcoin episode highlights one truth about crypto: timing and information make the difference between profit and loss. And in an ecosystem driven by volatility, Token Metrics is designed to be your advantage.

Here’s what traders gain by using Token Metrics:

  • 🔎 Real-time trading signals for thousands of tokens
  • 💹 AI-powered market insights — fast, clean, and actionable
  • 📈 Dynamic grades and rankings updated daily
  • 🧠 Narrative awareness with filters for rising themes
  • 🧰 Toolkits for beginners and pros alike

Whether you’re scalping new tokens or investing in long-term projects, Token Metrics provides the data, structure, and confidence you need to trade smarter.

Looking Forward: Where Does the Market Go Next?

As Launch Coin cools, traders are asking: what’s the next 10x narrative?

Right now, data suggests that AI agents, DeFi primitives, and multi-chain interoperability are gaining traction. On the Token Metrics platform, the top-ranking bullish signals this week include several tokens tied to machine learning infrastructure and decentralized lending vaults.

But don’t wait for a newsletter to tell you what’s trending.

Explore the Token Metrics Market Page, set your filters, track the signals, and ride the next wave before it peaks. Because in crypto, the early bird doesn’t just get the worm — it gets the alpha.

Final Word: Stay Curious, Stay Cautious — and Stay Informed

Narratives will always rise and fall. What matters is your ability to spot when a hype cycle is starting — and when it’s ending.

With Token Metrics, you get more than just indicators. You get a full platform designed to surface truth beneath the noise — helping you trade with conviction, not confusion.

The Launchcoin cycle is a reminder of how fast crypto moves — and how important it is to trade with insight, speed, and structure.

Explore the platform today at tokenmetrics.com, and don’t just follow the narrative — trade it.

Research

How to Find the Next 10x Crypto Token with Token Metrics

Token Metrics Team
4 min

Every crypto investor dreams of discovering that one hidden gem — the token that goes from unknown to unstoppable, delivering 10x or even 50x returns. But with over 25,000 cryptocurrencies on the market in 2025, the big question remains: how do you actually find the one that will moon before the crowd catches on?

That’s where Token Metrics steps in.

By combining AI-powered crypto signals, narrative filters, advanced grading systems, and deep-dive analytics, Token Metrics makes it easier than ever to identify high-potential projects early — and trade them with confidence.

Whether you’re a retail trader looking for your first big win, or a seasoned investor building a crypto portfolio, Token Metrics gives you the tools to make smarter, faster, and more profitable decisions.

The 10x Formula: What Really Drives Explosive Growth in Crypto?

Not every token is destined for greatness. But nearly every 10x token follows a pattern before it takes off. At Token Metrics, we’ve studied thousands of chart patterns, price trends, and fundamental indicators to isolate the key ingredients most 10x tokens share before they explode:

🔥 1. Bold Signal Trigger

These are early-stage AI signals generated when a token begins to show strong upside potential. Token Metrics’ AI tracks market data, price momentum, sentiment, and technical indicators to identify early breakout signals.

📈 2. High Trader & Investor Grades

  • Trader Grade reflects short-term price action, momentum, and volume.
  • Investor Grade scores long-term potential based on liquidity, backers, tokenomics, community traction, and fundamentals.

When both grades are high — especially above 80 or 90 — it’s often a green light.

🌐 3. Trending Narrative

Every bull run has its dominant themes: DeFi in 2020, NFTs in 2021, AI and Modular Chains in 2025. A token aligned with a current hot narrative is more likely to gain attention and capital inflow.

📊 4. Community Growth

Real traction shows up through social media engagement, Discord activity, Telegram volume, GitHub commits, and on-chain user growth. Token Metrics integrates this into its AI analysis to measure rising network effect.

Token Metrics in Action: The Launch Coin Case Study

To see this in action, let’s look at Launchcoin, one of the most explosive tokens of early 2025. Launchcoin allowed anyone to tokenize ideas through social media replies — making it the centerpiece of the creator token narrative.

It went from stealth mode to stardom in days, ultimately delivering a 35x return for users who caught it early. How?

  • ✅ It appeared on the Token Metrics Market Page with a bold signal.
  • Trader Grade > 90 indicated massive price momentum.
  • ✅ The token was embedded in the hot social token narrative.
  • ✅ Community activity on X (formerly Twitter) and Discord spiked rapidly.

Users who followed the early bold signal and confirmed it with high grades had the data needed to act decisively — and ride the wave before it crested.

Token Metrics Tools That Help You Spot the Next 10x

Token Metrics isn’t just a signal service — it’s a full-suite crypto analytics platform designed to help traders and investors discover, analyze, and act on opportunities before the crowd.

Here are the core tools that help you catch winners early:

🔍 1. Market Page

View a curated dashboard of the latest AI-generated bold signals, updated in real time. Filter by:

  • Signal strength
  • Trader or Investor Grade
  • Chain (Ethereum, Solana, Base, etc.)
  • Sector (AI, DeFi, Gaming, Modular, Memecoins)
  • ROI since signal

This is your front-line tool for finding high-upside tokens before they trend on social media or exchanges.

📄 2. Token Detail Pages

Dig deeper into any token with complete analysis, including:

  • Grade breakdowns (with reasoning)
  • Historical signal performance
  • Price charts with annotated buy/sell points
  • Narrative classification
  • Community sentiment metrics

These pages help you validate and compare tokens before jumping in.

🧠 3. Narrative Filters

Narratives drive attention and capital in crypto. Use AI-driven filters to discover tokens within hot themes like:

  • AI Agents
  • Modular Chains
  • RWA (Real World Assets)
  • DeFi Lending
  • Gaming Tokens
  • Social & Creator Tokens

Narrative filtering helps you spot which sectors are heating up and which tokens are leading the charge.

🚀 4. Top Gainers Tab

Get a real-time feed of tokens that are climbing the ranks fastest based on signal performance, volume, and momentum. Great for catching short-term breakouts.

📬 5. Alerts and Watchlists

Set custom alerts for:

  • Grade thresholds
  • New bold signals
  • Tokens entering Top Gainers
  • Narrative rotations

This ensures you never miss a move — even if you’re not logged in 24/7.

Tips for Finding the Next 10x Crypto Token

Using Token Metrics gives you an edge, but timing and execution still matter. Here are key strategies:

Act Fast on Bold Signals

Early bold signals are where most 10x gains start. Check the Market Page daily and move quickly when grades align.

Use Grade Confirmation

Don’t just chase price action. Look for both Trader and Investor Grades above 80 — ideally above 90 for the biggest potential moves.

Monitor Narrative Cycles

Tokens in trending narratives often rise faster. Track narrative heatmaps on Token Metrics to stay aligned with the market zeitgeist.

Revisit Signals Daily

Momentum can shift fast. A token might go from a bold signal to a breakout in 24–48 hours. Stay on top of daily updates.

Diversify Across Narratives

Don’t go all-in on one theme. Spread bets across AI, DeFi, Memes, and Infrastructure to capture multiple emerging waves.

Token Metrics: Making Crypto Trading Easier, Smarter, and More Profitable

The crypto markets can be overwhelming — with noise, scams, and hype around every corner. Token Metrics simplifies the process by turning complex data into actionable insights.

Whether you're looking to catch your first 10x, avoid false pumps, or build a smart long-term crypto portfolio, Token Metrics gives you:

  • 🧠 Clarity in a noisy market
  • 📊 Data-backed conviction instead of guessing
  • Speed in identifying trends before they peak
  • Confidence to buy, hold, or exit with precision

With tools designed for traders, investors, and builders alike, Token Metrics turns analytics into alpha.

Final Thoughts: Don’t Chase Pumps — Predict Them

The next 10x token is already out there. It might be trading under the radar today, quietly showing early signs — a bold signal, strong grade, growing community.

Token Metrics is your map.

You don’t need to follow the crowd. With the right tools and discipline, you can trade ahead of the market, find the next Launchcoin, and position yourself for outsized gains.

Start your journey now at tokenmetrics.com — because in crypto, alpha favors the informed.

Thank you! Your submission has been received!
Oops! Something went wrong while submitting the form.

Featured Posts

Crypto Basics Blog

Research Blogs

Announcement Blogs

Unlock the Secrets of Cryptocurrency

Sign Up for the Newsletter for the Exclusive Updates