


.png)


.png)
.png)


.png)


.png)
%201%20(1).png)

.png)


.png)


.png)
.png)


.png)


.png)

.png)
.png)
.png)
.png)
.png)
.png)
.png)
.png)
.png)


.png)


.png)

.png)
.png)


.png)


.png)
.png)
.png)
.png)

.png)
.png)


Research
Top Crypto Trading Platforms in 2025
When it comes to crypto trading platforms, Token Metrics is not an exchange, but a crypto analytics and crypto trading intelligence platform powered by AI.
Token Metrics Team
10


%201.svg)
%201.svg)
Big news: We’re cranking up the heat on AI-driven crypto analytics with the launch of the Token Metrics API and our official SDK (Software Development Kit). This isn’t just an upgrade – it's a quantum leap, giving traders, hedge funds, developers, and institutions direct access to cutting-edge market intelligence, trading signals, and predictive analytics.
Crypto markets move fast, and having real-time, AI-powered insights can be the difference between catching the next big trend or getting left behind. Until now, traders and quants have been wrestling with scattered data, delayed reporting, and a lack of truly predictive analytics. Not anymore.
The Token Metrics API delivers 32+ high-performance endpoints packed with powerful AI-driven insights right into your lap, including:
Getting started with the Token Metrics API is simple:
At Token Metrics, we believe data should be decentralized, predictive, and actionable.
The Token Metrics API & SDK bring next-gen AI-powered crypto intelligence to anyone looking to trade smarter, build better, and stay ahead of the curve. With our official SDK, developers can plug these insights into their own trading bots, dashboards, and research tools – no need to reinvent the wheel.
The crypto market is tilting bullish into 2026 as liquidity, infrastructure, and participation improve across the board. Clearer rules and standards are reshaping the classic four-year cycle, flows can arrive earlier, and strength can persist longer than in prior expansions.
Institutional access is widening through ETFs and custody, while L2 scaling and real-world integrations help sustain on‑chain activity. This healthier backdrop frames our scenario work for HYPE. The ranges below reflect different total crypto market sizes and the share Hyperliquid could capture under each regime.

Disclosure
Educational purposes only, not financial advice. Crypto is volatile, do your own research and manage risk.
How to read it: Each band blends cycle analogues and market-cap share math with TA guardrails. Base assumes steady adoption and neutral or positive macro. Moon layers in a liquidity boom. Bear assumes muted flows and tighter liquidity.
TM Agent baseline: Token Metrics TM Grade is 73.9%, a Buy, and the trading signal is bearish, indicating short-term downward momentum. This means Token Metrics judges HYPE as fundamentally attractive over the long term, while near-term momentum is negative and may limit rallies.
Live details: Hyperliquid Token Details
Affiliate Disclosure: We may earn a commission from qualifying purchases made via this link, at no extra cost to you.
Scenario Analysis
Token Metrics scenarios span four market cap tiers, each representing different levels of crypto market maturity and liquidity:
8T: At an 8 trillion dollar total crypto market cap, HYPE projects to $48.81 in bear conditions, $49.92 in the base case, and $51.03 in bullish scenarios.
16T: Doubling the market to 16 trillion expands the range to $50.72 (bear), $54.05 (base), and $57.38 (moon).
23T: At 23 trillion, the scenarios show $52.62, $58.17, and $63.72 respectively.
31T: In the maximum liquidity scenario of 31 trillion, HYPE could reach $54.52 (bear), $62.29 (base), or $70.07 (moon).
Each tier assumes progressively stronger market conditions, with the base case reflecting steady growth and the moon case requiring sustained bull market dynamics.
Diversification matters. HYPE is compelling, yet concentrated bets can be volatile. Token Metrics Indices hold HYPE alongside the top one hundred tokens for broad exposure to leaders and emerging winners.
Our backtests indicate that owning the full market with diversified indices has historically outperformed both the total market and Bitcoin in many regimes due to diversification and rotation.
Hyperliquid is a decentralized exchange focused on perpetual futures with a high-performance order book architecture. The project emphasizes low-latency trading, risk controls, and capital efficiency aimed at professional and retail derivatives traders. Its token, HYPE, is used for ecosystem incentives and governance-related utilities.
Can HYPE reach $60?
Yes, the 23T and 31T tiers imply ranges above $60 in the Base and Moon bands, though outcomes depend on liquidity and adoption. Not financial advice.
Is HYPE a good long-term investment?
Outcome depends on adoption, liquidity regime, competition, and supply dynamics. Diversify and size positions responsibly.
Disclosure
Educational purposes only, not financial advice. Crypto is volatile, do your own research and manage risk.
Token Metrics delivers AI-based crypto ratings, scenario projections, and portfolio tools so you can make smarter decisions. Discover real-time analytics on Token Metrics.
The Layer 1 competitive landscape is consolidating as markets recognize that specialization matters more than being a generic "Ethereum killer." Cardano positions itself in this multi-chain world with specific technical and ecosystem advantages. Infrastructure maturity around custody, bridges, and developer tools makes alternative L1s more accessible heading into 2026.
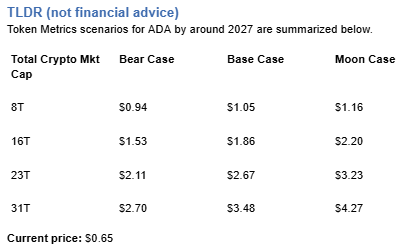
The scenario projections below map different market share outcomes for ADA across varying total crypto market sizes. Base cases assume Cardano maintains current ecosystem momentum, while moon scenarios factor in accelerated adoption and bear cases reflect increased competitive pressure.
Disclosure
Educational purposes only, not financial advice. Crypto is volatile, do your own research and manage risk.
How to read it: Each band blends cycle analogues and market-cap share math with TA guardrails. Base assumes steady adoption and neutral or positive macro. Moon layers in a liquidity boom. Bear assumes muted flows and tighter liquidity.
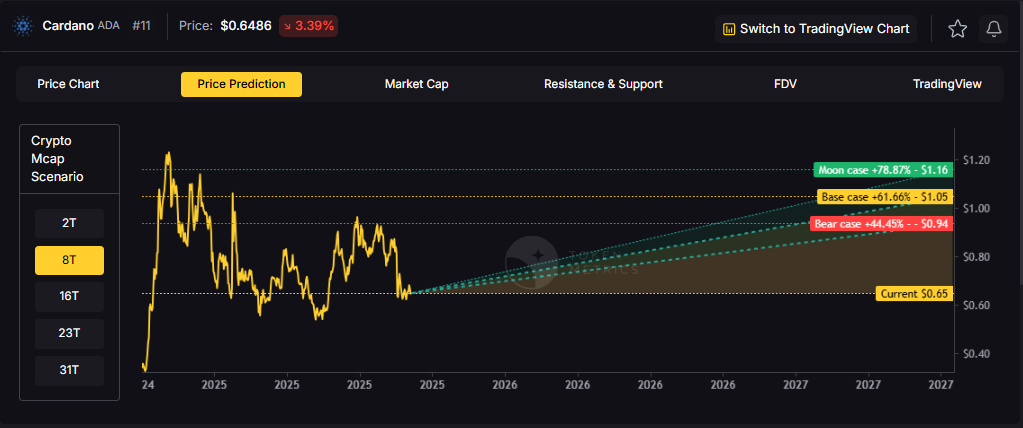
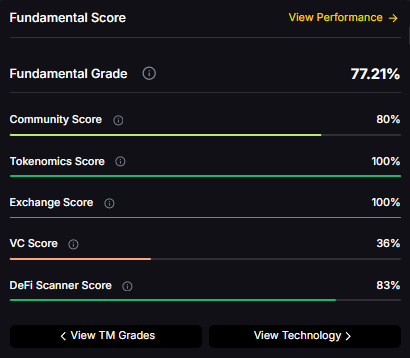
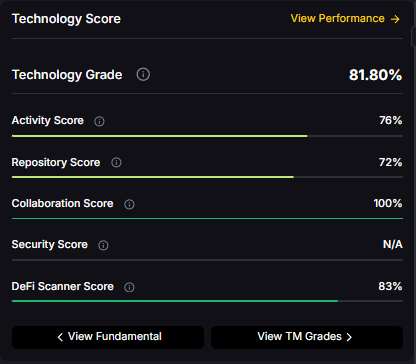
TM Agent baseline: Token Metrics lead metric for Cardano, cashtag $ADA, is a TM Grade of 29.72%, which translates to a Sell, and the trading signal is bearish, indicating short-term downward momentum. This combination means Token Metrics does not currently endorse $ADA as a long-term buy at current levels. A brief market context: Bitcoin's direction remains the dominant macro driver for smart contract platforms, so sustained upside for $ADA would require a broader crypto risk-on regime and improving fundamentals or developer activity for Cardano.
Live details: Cardano Token Details
Affiliate Disclosure: We may earn a commission from qualifying purchases made via this link, at no extra cost to you.
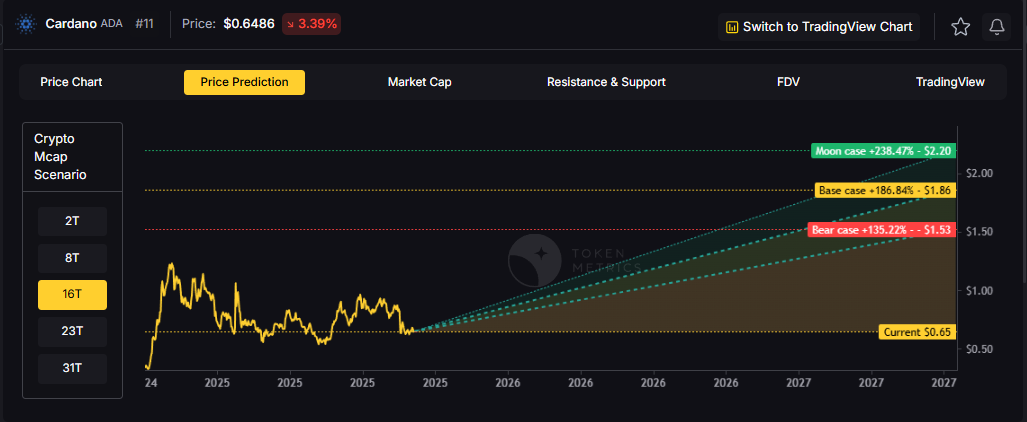
Token Metrics scenarios span four market cap tiers, each representing different levels of crypto market maturity and liquidity:


Each tier assumes progressively stronger market conditions, with the base case reflecting steady growth and the moon case requiring sustained bull market dynamics.
Cardano represents one opportunity among hundreds in crypto markets. Token Metrics Indices bundle ADA with top one hundred assets for systematic exposure to the strongest projects. Single tokens face idiosyncratic risks that diversified baskets mitigate.
Historical index performance demonstrates the value of systematic diversification versus concentrated positions.
Cardano is a blockchain platform designed to support secure, scalable, and sustainable decentralized applications and smart contracts. It is known for its research-driven development approach, emphasizing peer-reviewed academic research and formal verification methods to ensure reliability and security. As a proof-of-stake Layer 1 blockchain, Cardano aims to offer energy efficiency and long-term scalability, positioning itself as a competitor to platforms like Ethereum. Its native token, ADA, is used for transactions, staking, and governance. Adoption is driven by technological rigor and ecosystem growth, though progress has been criticized for being slow compared to more agile competitors. Risks include execution delays, competition, and market volatility.
Cardano’s vision is to create a decentralized platform that enables sustainable and inclusive economic systems through advanced cryptography and scientific methodology. It aims to bridge gaps between traditional financial systems and blockchain technology, promoting accessibility and security for users globally.
Token Metrics AI provides comprehensive context on Cardano's positioning and challenges.
Can ADA reach $4?
Based on the scenarios, ADA could reach $4 in the 31T moon case. The 31T tier projects $4.27 in the moon case. Not financial advice.
Can ADA 10x from current levels?
At current price of $0.65, a 10x would reach $6.50. This falls within none of the provided scenarios, which top out at $4.27 in the 31T moon case. Bear in mind that 10x returns require substantial market cap expansion. Not financial advice.
What price could ADA reach in the moon case?
Moon case projections range from $1.16 at 8T to $4.27 at 31T. These scenarios assume maximum liquidity expansion and strong Cardano adoption. Not financial advice.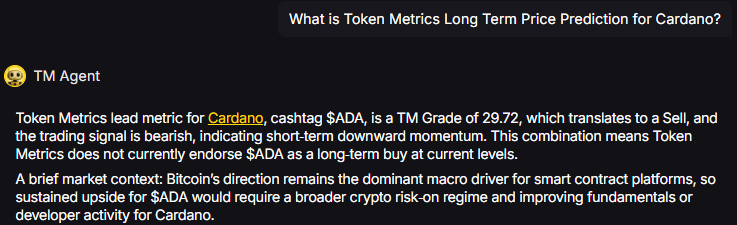
Disclosure
Educational purposes only, not financial advice. Crypto is volatile, do your own research and manage risk.
The intersection of artificial intelligence and blockchain technology has produced numerous innovations, but few have the potential architectural significance of X402. This internet protocol, developed by Coinbase and Cloudflare, is positioning itself as the standard for machine-to-machine payments in an increasingly AI-driven digital economy.
X402 is an open protocol designed specifically for internet-native payments. To understand its significance, we need to consider how the internet operates through layered protocols:
While these protocols have existed for decades, X402 - despite being available for over ten years - has only recently found its primary use case: enabling autonomous AI agents to conduct commerce without human intervention.
Traditional digital payments require several prerequisites that create friction for automated systems:
AI agents operating autonomously need to:
X402 addresses these challenges by creating a standardized payment layer that operates at the protocol level.
The protocol functions as a real-time usage billing meter integrated directly into API requests. Here's a simplified workflow:
This architecture enables transactions "up to a penny in under a second," according to protocol specifications.
One of the most practical examples of X402 integration comes from Token Metrics, which has implemented X402 as a pay-per-call option for their cryptocurrency analytics API. This implementation demonstrates the protocol's value proposition in action.
Token Metrics X402 Pricing Structure:
Why This Matters:
This pricing model fundamentally differs from traditional API access:
Traditional Model:
X402 Model:
For AI agents performing crypto market analysis, this creates significant efficiency:
This implementation showcases X402's core value proposition: removing friction between autonomous systems and the services they consume.
Analysis of X402scan data reveals the emerging adoption patterns:
Leading Facilitators:
Transaction Metrics (30-day trends):
Several platforms have implemented X402 functionality:
API Services:
Rather than requiring monthly subscriptions, API providers can charge per request. Token Metrics exemplifies this model - an AI agent queries their crypto analytics API, pays between $0.017-$0.068 via X402 depending on the endpoint, and receives the data - all within milliseconds. The agent accesses:
This eliminates the traditional friction of:
AI Agent Platforms:
Cross-Chain Implementation: X402 operates on multiple blockchain networks, with notable activity on Base (Coinbase's Layer 2) and Solana.
The emergence of X402 as a standard has created several market dynamics:
Narrative-Driven Speculation: Projects announcing X402 integration have experienced significant short-term price appreciation, suggesting market participants view the protocol as a value catalyst.
Infrastructure vs. Application Layer: The protocol creates a distinction between:
Competitive Landscape: X402 faces competition from:
While AI commerce represents the primary narrative, X402's architecture supports broader applications:
Data Services: As demonstrated by Token Metrics, any API provider can implement pay-per-request pricing. Applications include:
Micropayment Content: Publishers could charge per-article access at fractional costs
IoT Device Transactions: Connected devices conducting autonomous commerce
Gaming Economies: Real-time, granular in-game transactions
Computing Resources: Pay-per-compute models for cloud services
Token Metrics' implementation reveals the business model advantages for service providers:
Revenue Optimization:
Market Access:
Operational Efficiency:
Several factors may impact X402 adoption:
Technical Complexity: Implementing X402 requires protocol-level integration, creating barriers for smaller developers.
Network Effects: Payment protocols succeed through widespread adoption. X402 competes with established systems and must reach critical mass.
Blockchain Dependency: Current implementations rely on blockchain networks for settlement, introducing:
Pricing Discovery: As seen with Token Metrics' range of $0.017-$0.068 per call, establishing optimal pricing requires experimentation. Too high and traditional subscriptions become competitive; too low and revenue suffers.
Regulatory Uncertainty: Automated machine-to-machine payments operating across borders face unclear regulatory frameworks.
Market Maturity: The AI agent economy remains nascent. X402's long-term relevance depends on AI agents becoming standard economic actors.
Traditional API Keys with Subscriptions:
X402 Pay-Per-Call:
Cryptocurrency Direct Payments:
Payment Processors (Stripe, PayPal):
X402's differentiator lies in combining protocol-level standardization with crypto-native functionality optimized for automated systems, as demonstrated by Token Metrics' implementation where AI agents can make sub-dollar API calls without human intervention.
For developers interested in X402 integration:
Documentation: X402.well (protocol specifications)
Discovery Platforms: X402scan (transaction analytics), The Bazaar (application directory)
Integration Frameworks: Virtuals Protocol, Eliza (Solana), various Base implementations
Live Examples: Token Metrics API (tokenmetrics.com/api) demonstrates production X402 implementation
Several blockchain platforms now offer X402 integration libraries, lowering implementation barriers.
Projects associated with X402 have demonstrated characteristic patterns:
Phase 1 - Announcement: Initial price appreciation upon X402 integration news Phase 2 - Peak Attention: Maximum price when broader market attention focuses on X402 narrative Phase 3 - Stabilization: Price correction as attention shifts to next narrative
PayAI's trajectory exemplifies this pattern - rapid 8x appreciation followed by significant correction within days. This suggests X402-related assets behave as narrative-driven trading vehicles rather than fundamental value plays, at least in current market conditions.
However, service providers implementing X402 functionality (like Token Metrics) represent a different category - they're adding practical utility rather than speculating on the protocol itself.
The protocol's trajectory depends on several factors:
AI Agent Proliferation: As AI agents become more autonomous and economically active, demand for payment infrastructure grows. Early implementations like Token Metrics' API access suggest practical demand exists.
Developer Adoption: Whether developers choose X402 over alternatives will determine market position. The simplicity of pay-per-call models may drive adoption.
Service Provider Economics: If providers like Token Metrics successfully monetize X402 access, other API services will follow. The ability to capture previously inaccessible low-usage customers creates compelling economics.
Institutional Support: Coinbase's backing provides credibility, but sustained development and promotion are necessary.
Regulatory Clarity: Clear frameworks for automated, cross-border machine transactions would reduce adoption friction.
Interoperability Standards: Success may require coordination with other emerging AI commerce protocols.
X402 represents an attempt to solve genuine infrastructure challenges in an AI-driven economy. The protocol's technical architecture addresses real friction points in machine-to-machine commerce, as demonstrated by Token Metrics' implementation of pay-per-call API access at $0.017-$0.068 per request with no commitments required.
This real-world deployment validates the core thesis: AI agents need frictionless, usage-based access to services without traditional account creation and subscription barriers. However, actual adoption remains in early stages, and the protocol faces competition from both traditional systems and alternative blockchain solutions.
For market participants, X402-related projects should be evaluated based on:
The protocol's long-term relevance will ultimately be determined by whether AI agents become significant economic actors requiring standardized payment infrastructure. While the technical foundation appears sound and early implementations show promise, market validation remains ongoing.
Key Takeaways:
This analysis is for informational purposes only. X402 adoption and associated project performance remain highly uncertain and subject to rapid change.
.svg)


.png)
Token Metrics Media LLC is a regular publication of information, analysis, and commentary focused especially on blockchain technology and business, cryptocurrency, blockchain-based tokens, market trends, and trading strategies.
Token Metrics Media LLC does not provide individually tailored investment advice and does not take a subscriber’s or anyone’s personal circumstances into consideration when discussing investments; nor is Token Metrics Advisers LLC registered as an investment adviser or broker-dealer in any jurisdiction.
Information contained herein is not an offer or solicitation to buy, hold, or sell any security. The Token Metrics team has advised and invested in many blockchain companies. A complete list of their advisory roles and current holdings can be viewed here: https://tokenmetrics.com/disclosures.html/
Token Metrics Media LLC relies on information from various sources believed to be reliable, including clients and third parties, but cannot guarantee the accuracy and completeness of that information. Additionally, Token Metrics Media LLC does not provide tax advice, and investors are encouraged to consult with their personal tax advisors.
All investing involves risk, including the possible loss of money you invest, and past performance does not guarantee future performance. Ratings and price predictions are provided for informational and illustrative purposes, and may not reflect actual future performance.


%20Price%20Prediction%202025%2C%202030%20-%20Forecast%20Analysis.png)


.png)

%20Price%20Prediction%20.webp)


%20Price%20Prediction.webp)


%20Price%20Prediction%20Analysis%20-%20Can%20it%20Reach%20%24500%20in%20Future_.png)


