


.png)


.png)
.png)


.png)


.png)
%201%20(1).png)

.png)


.png)


.png)
.png)


.png)


.png)

.png)
.png)
.png)
.png)
.png)
.png)
.png)
.png)
.png)


.png)


.png)

.png)
.png)


.png)


.png)
.png)
.png)
.png)

.png)
.png)


Research
Top Crypto Trading Platforms in 2025
When it comes to crypto trading platforms, Token Metrics is not an exchange, but a crypto analytics and crypto trading intelligence platform powered by AI.
Token Metrics Team
10 min


%201.svg)
%201.svg)
Big news: We’re cranking up the heat on AI-driven crypto analytics with the launch of the Token Metrics API and our official SDK (Software Development Kit). This isn’t just an upgrade – it's a quantum leap, giving traders, hedge funds, developers, and institutions direct access to cutting-edge market intelligence, trading signals, and predictive analytics.
Crypto markets move fast, and having real-time, AI-powered insights can be the difference between catching the next big trend or getting left behind. Until now, traders and quants have been wrestling with scattered data, delayed reporting, and a lack of truly predictive analytics. Not anymore.
The Token Metrics API delivers 32+ high-performance endpoints packed with powerful AI-driven insights right into your lap, including:
Getting started with the Token Metrics API is simple:
At Token Metrics, we believe data should be decentralized, predictive, and actionable.
The Token Metrics API & SDK bring next-gen AI-powered crypto intelligence to anyone looking to trade smarter, build better, and stay ahead of the curve. With our official SDK, developers can plug these insights into their own trading bots, dashboards, and research tools – no need to reinvent the wheel.
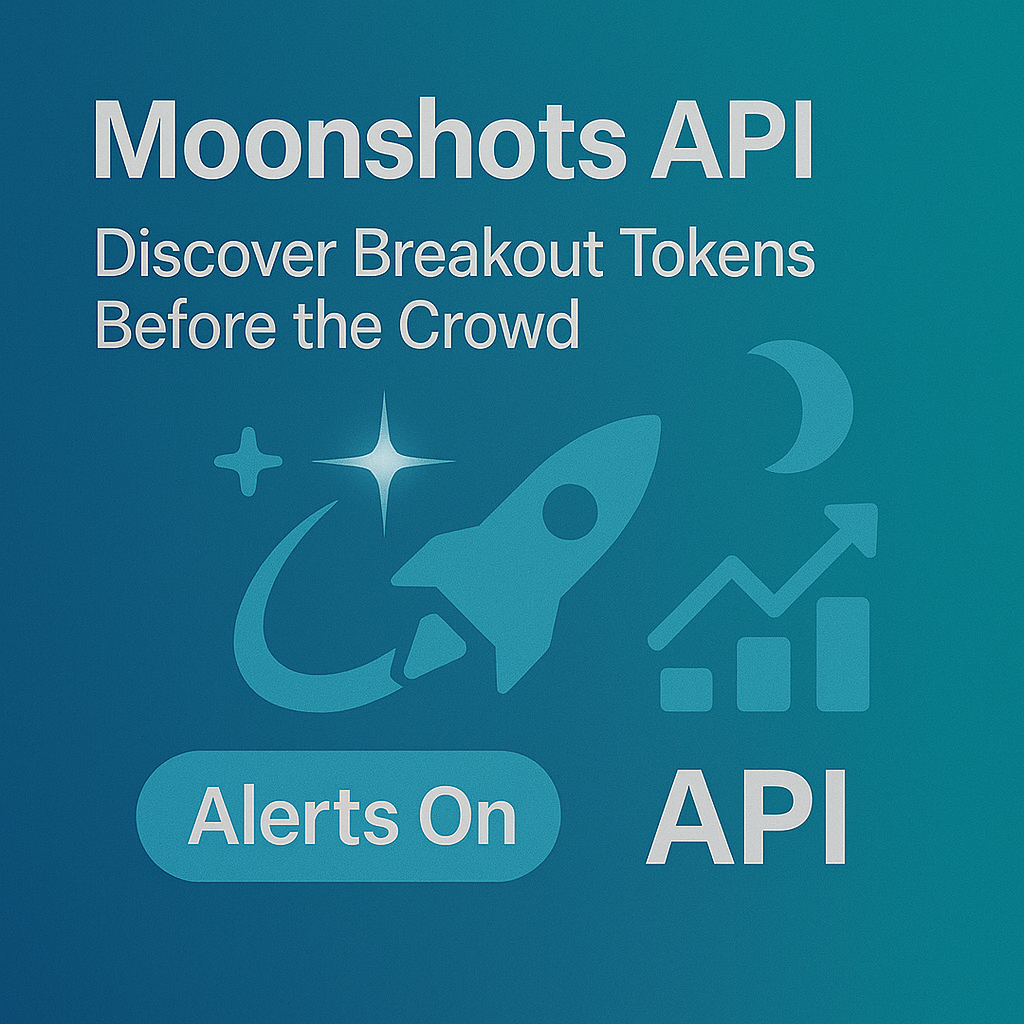
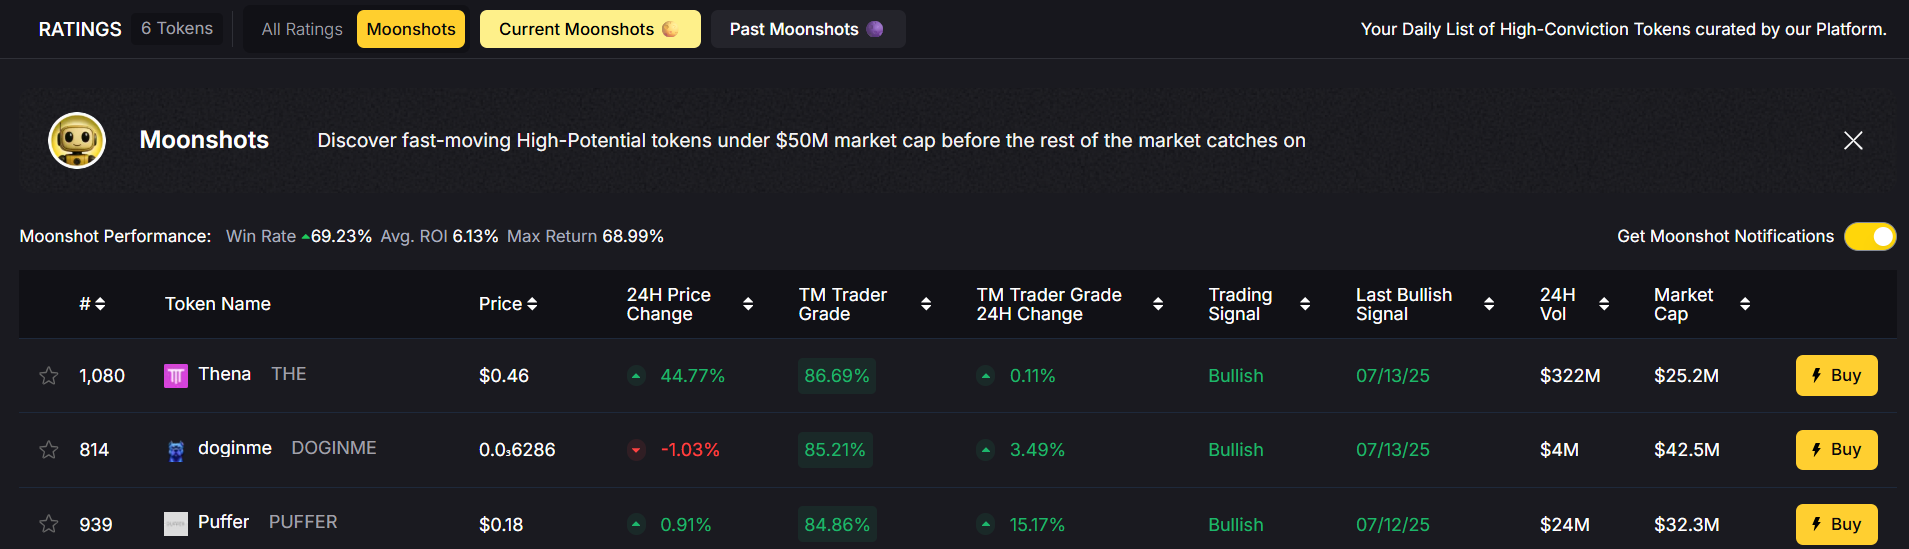
The biggest gains in crypto rarely come from the majors. They come from Moonshots—fast-moving tokens with breakout potential. The Moonshots API surfaces these candidates programmatically so you can rank, alert, and act inside your product. In this guide, you’ll call /v2/moonshots, display a high-signal list with TM Grade and Bullish tags, and wire it into bots, dashboards, or screeners in minutes. Start by grabbing your key at Get API Key, then Run Hello-TM and Clone a Template to ship fast.
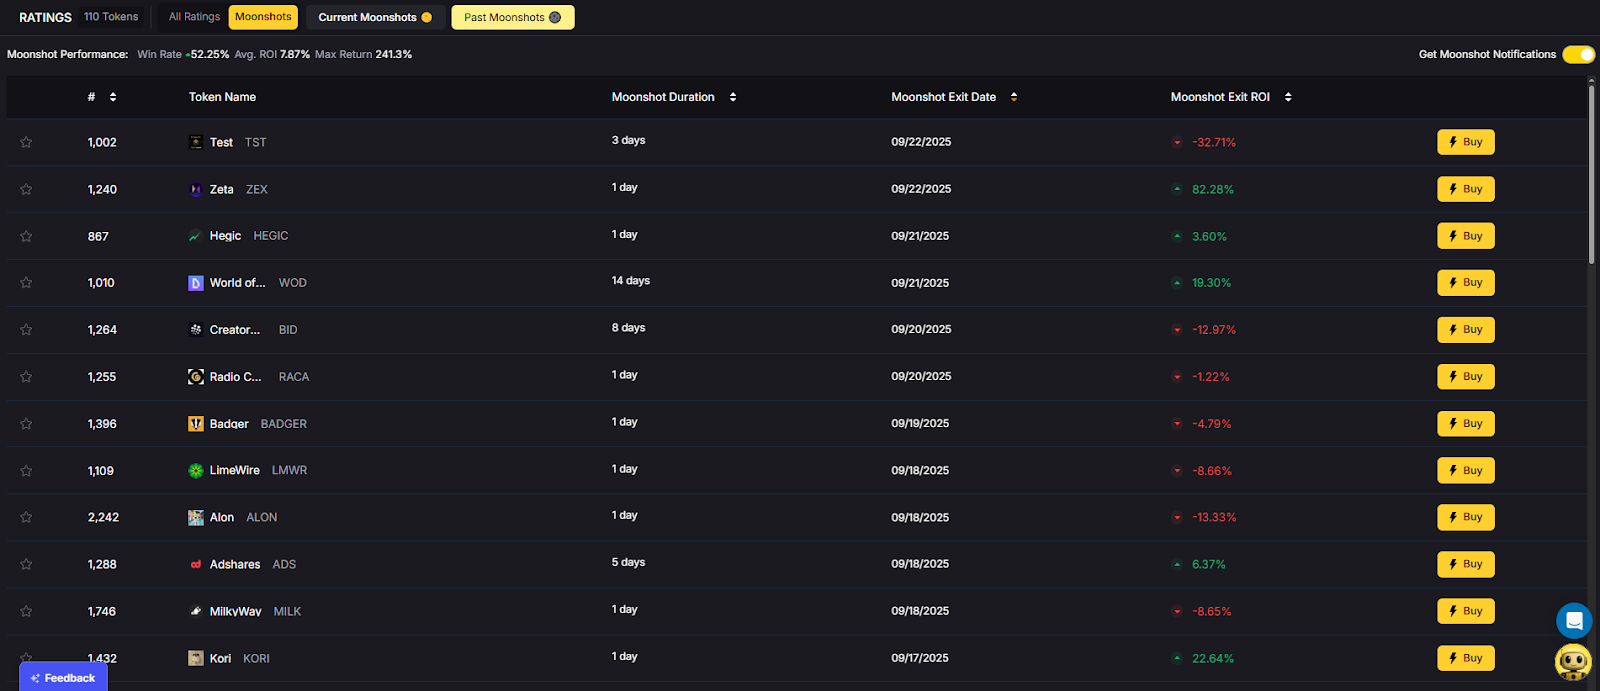
Discovery that converts. Users want more than price tickers—they want a curated, explainable list of high-potential tokens. The moonshots API encapsulates multiple signals into a short list designed for exploration, alerts, and watchlists you can monetize.
Built for builders. The endpoint returns a consistent schema with grade, signal, and context so you can immediately sort, badge, and trigger workflows. With predictable latency and clear filters, you can scale to dashboards, mobile apps, and headless bots without reinventing the discovery pipeline.
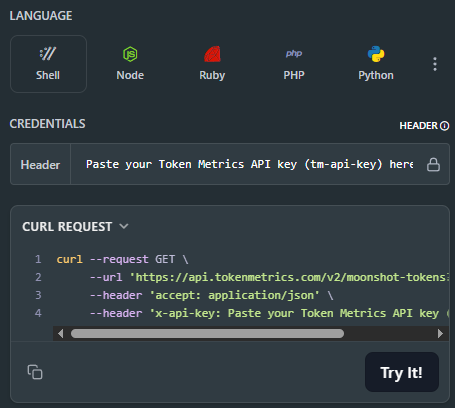
The Moonshots API cURL request is right there in the top right of the API Reference. Grab it and start tapping into the potential!
👉 Keep momentum: Get API Key • Run Hello-TM • Clone a Template
Fork a screener or alerting template, plug your key, and deploy. Validate your environment with Hello-TM. When you scale users or need higher limits, compare API plans.
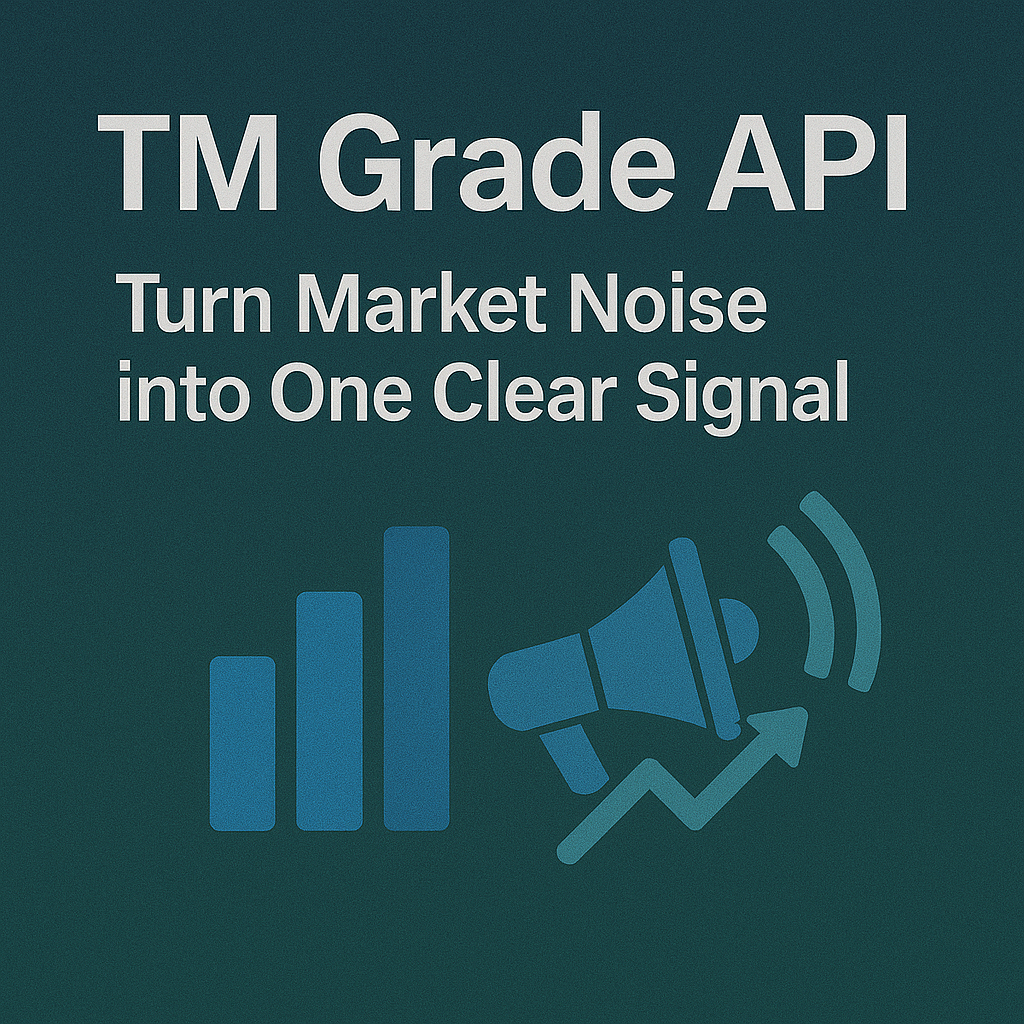
The Moonshots endpoint aggregates a set of evidence—often combining TM Grade, signal state, and momentum/volume context—into a shortlist of breakout candidates. Each row includes a symbol, grade, signal, and timestamp, plus optional reason tags for transparency.
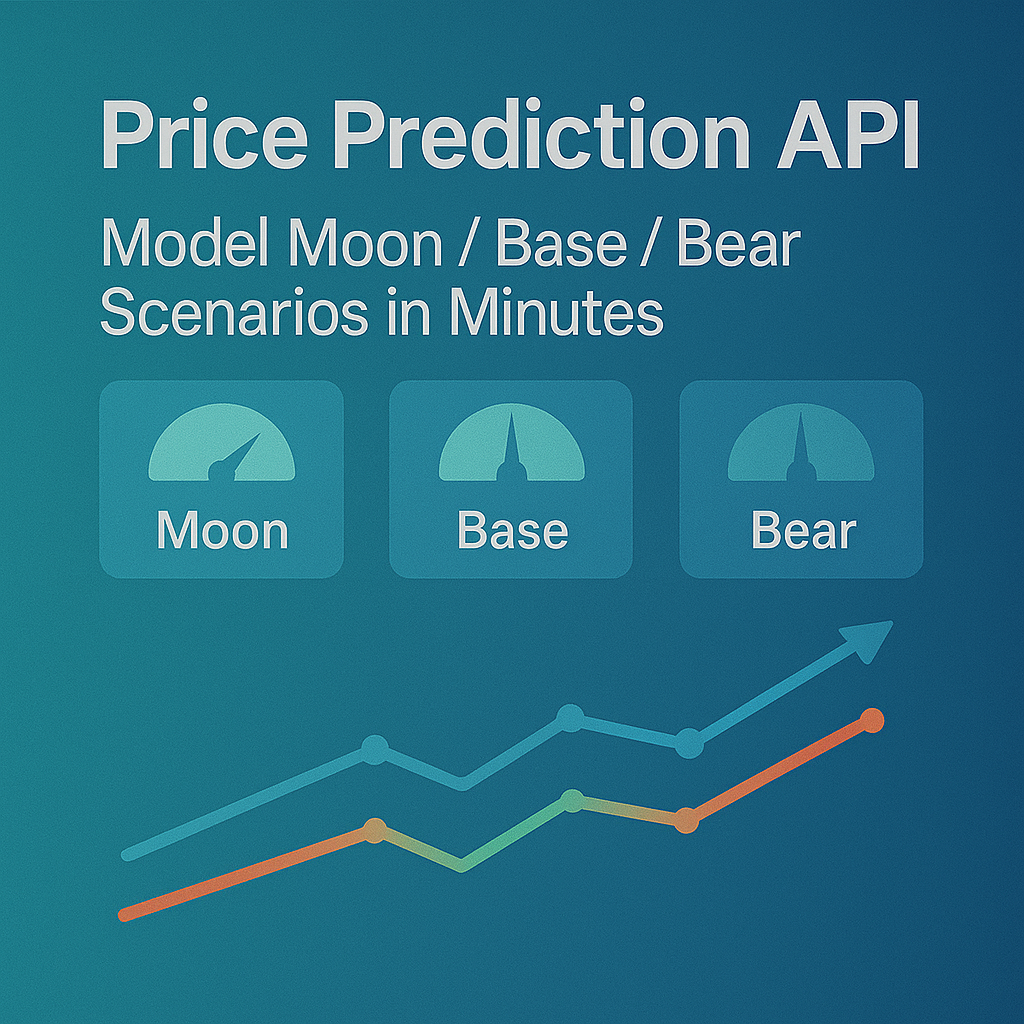
For UX, a common pattern is: headline list → token detail where you render TM Grade (quality), Trading Signals (timing), Support/Resistance (risk placement), Quantmetrics (risk-adjusted performance), and Price Prediction scenarios. This lets users understand why a token was flagged and how to act with risk controls.
Polling vs webhooks. Dashboards typically poll with short-TTL caching. Alerting flows use scheduled jobs or webhooks (where available) to smooth traffic and avoid duplicates. Always make notifications idempotent.
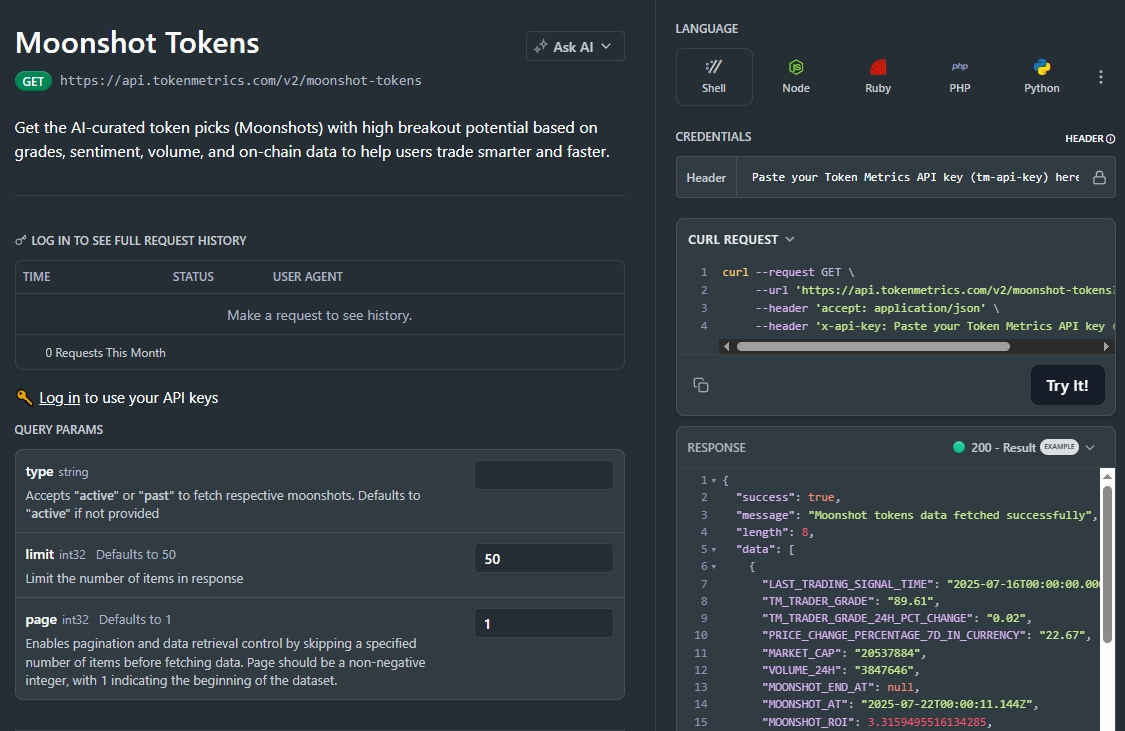
1) What does the Moonshots API return?
A list of breakout candidates with fields such as symbol, tm_grade, signal (often Bullish/Bearish), optional reason tags, and updated_at. Use it to drive discover tabs, alerts, and watchlists.
2) How fresh is the list? What about latency/SLOs?
The endpoint targets predictable latency and timely updates for dashboards and alerts. Use short-TTL caching and queued jobs/webhooks to avoid bursty polling.
3) How do I use Moonshots in a trading workflow?
Common stack: Moonshots for discovery, Trading Signals for timing, Support/Resistance for SL/TP, Quantmetrics for sizing, and Price Prediction for scenario context. Always backtest and paper-trade first.
4) I saw results like “+241%” and a “7.5% average return.” Are these guaranteed?
No. Any historical results are illustrative and not guarantees of future performance. Markets are risky; use risk management and testing.
5) Can I filter the Moonshots list?
Yes—pass parameters like min_grade, signal, and limit (as supported) to tailor to your audience and keep pages fast.
6) Do you provide SDKs or examples?
REST works with JavaScript and Python snippets above. Docs include quickstarts, Postman collections, and templates—start with Run Hello-TM.
7) Pricing, limits, and enterprise SLAs?
Begin free and scale up. See API plans for rate limits and enterprise options.
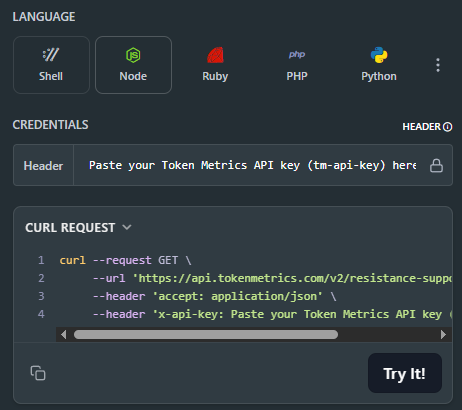
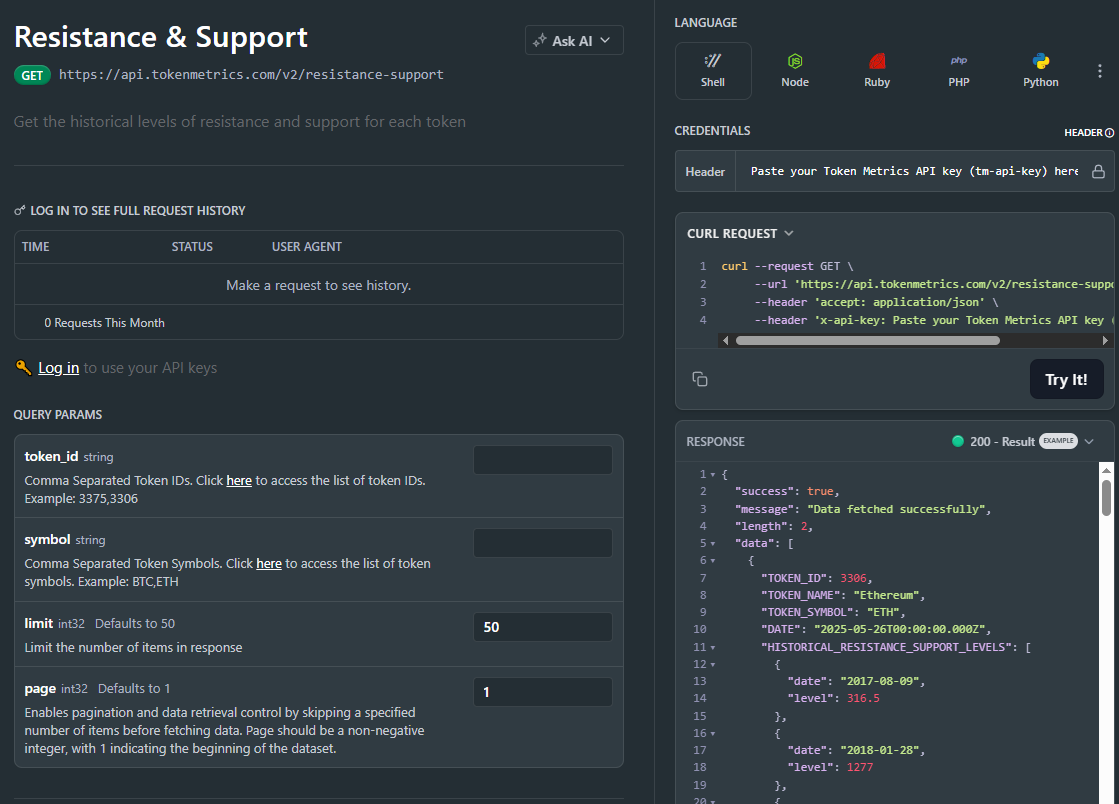
Most traders still draw lines by hand in TradingView. The support and resistance API from Token Metrics auto-calculates clean support and resistance levels from one request, so your dashboard, bot, or alerts can react instantly. In minutes, you’ll call /v2/resistance-support, render actionable levels for any token, and wire them into stops, targets, or notifications. Start by grabbing your key on Get API Key, then Run Hello-TM and Clone a Template to ship a production-ready feature fast.
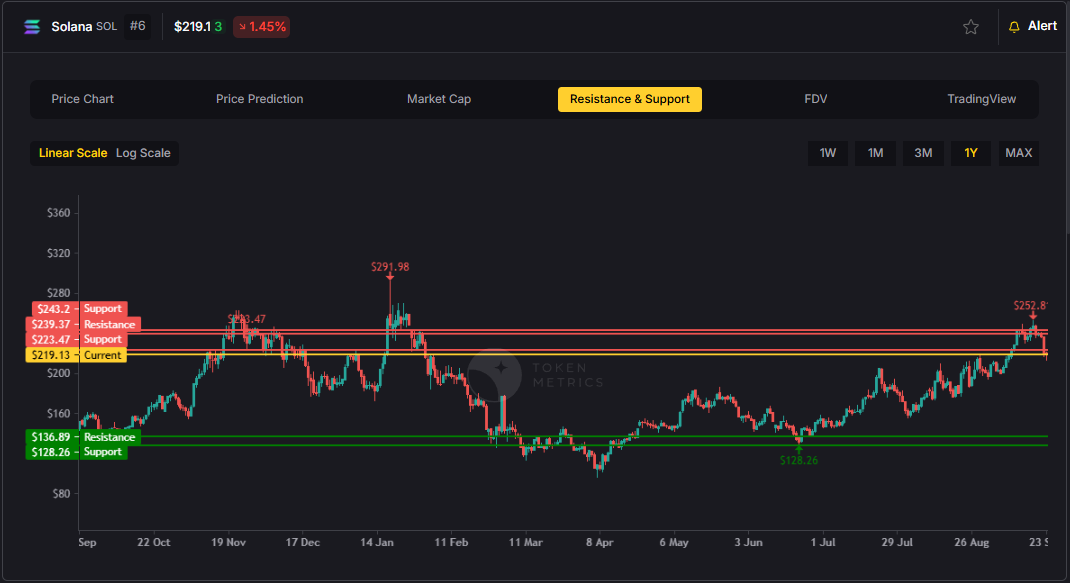
Precision beats guesswork. Hand-drawn lines are subjective and slow. The support and resistance API standardizes levels across assets and timeframes, enabling deterministic stops and take-profits your users (and bots) can trust.
Production-ready by design. A simple REST shape, predictable latency, and clear semantics let you add levels to token pages, automate SL/TP alerts, and build rule-based execution with minimal glue code.
Need the Support and Resistance data? The cURL request for it is in the top right of the API Reference for quick access.
👉 Keep momentum: Get API Key • Run Hello-TM • Clone a Template
Kick off with our quickstarts—fork a bot or dashboard template, plug your key, and deploy. Confirm your environment by Running Hello-TM. When you’re scaling or need webhooks/limits, review API plans.
The Support/Resistance endpoint analyzes recent price structure to produce discrete levels above and below current price, along with strength indicators you can use for priority and styling. Query /v2/resistance-support?symbol=<ASSET>&timeframe=<HORIZON> to receive arrays of level objects and timestamps.
Polling vs webhooks. For dashboards, short-TTL caching and batched fetches keep pages snappy. For bots and alerts, use queued jobs or webhooks (where applicable) to avoid noisy, bursty polling—especially around market opens and major events.
1) What does the Support & Resistance API return?
A JSON payload with arrays of support and resistance levels for a symbol (and optional timeframe), each with a price and strength indicator, plus an update timestamp.
2) How timely are the levels? What are the latency/SLOs?
The endpoint targets predictable latency suitable for dashboards and alerts. Use short-TTL caching for UIs, and queued jobs or webhooks for alerting to smooth traffic.
3) How do I trigger alerts or trades from levels?
Common patterns: alert when price is within X% of a level, touches a level, or breaks beyond with confirmation. Always make downstream actions idempotent and respect rate limits.
4) Can I combine levels with other endpoints?
Yes—pair with /v2/trading-signals for timing, /v2/tm-grade for quality context, and /v2/quantmetrics for risk sizing. This yields a complete decide-plan-execute loop.
5) Which timeframe should I use?
Intraday bots prefer shorter horizons; swing/position dashboards use daily or higher-timeframe levels. Offer a timeframe toggle and cache results per setting.
6) Do you provide SDKs or examples?
Use the REST snippets above (JS/Python). The docs include quickstarts, Postman collections, and templates—start with Run Hello-TM.
7) Pricing, limits, and enterprise SLAs?
Begin free and scale as you grow. See API plans for rate limits and enterprise SLA options.
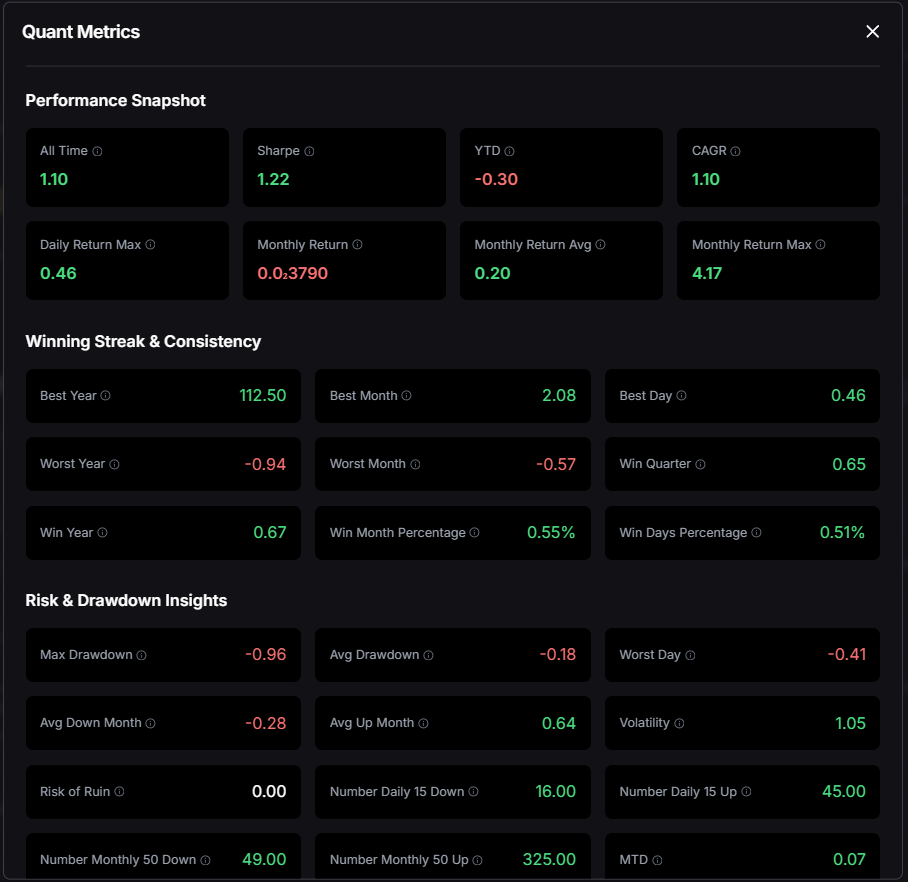
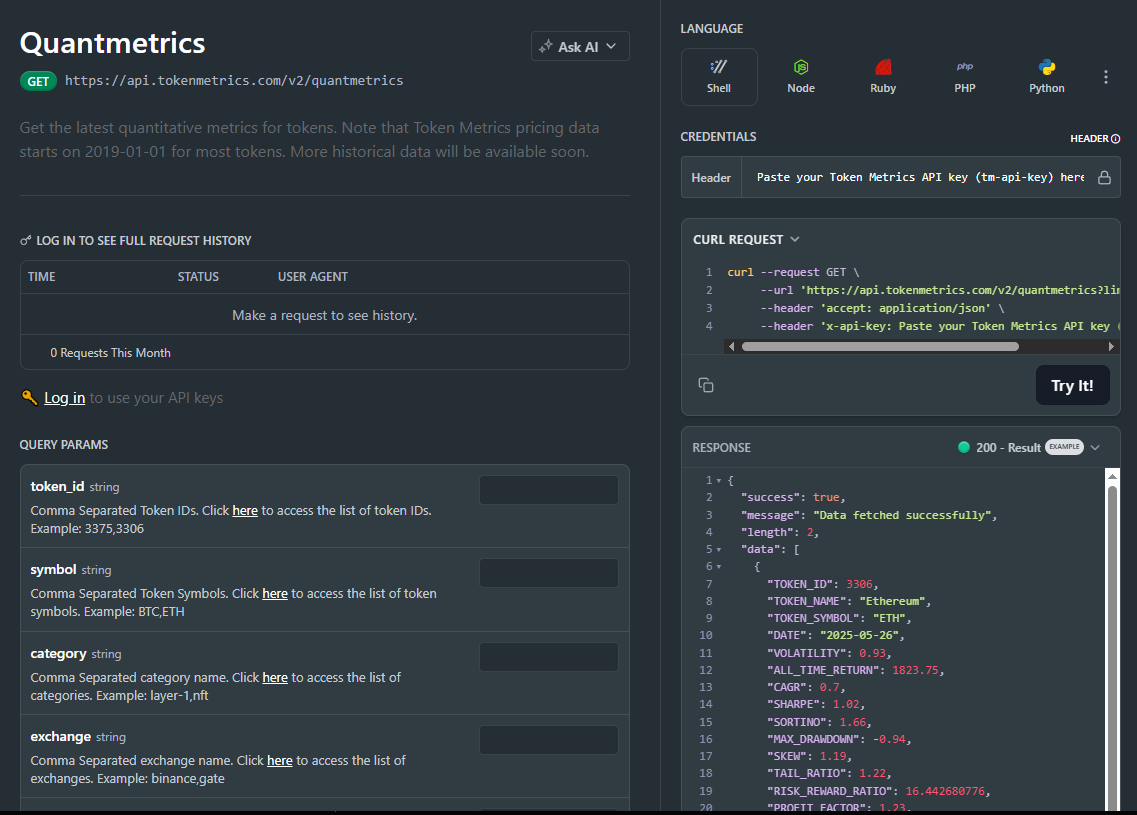
Most traders see price—quants see probabilities. The Quantmetrics API turns raw performance into risk-adjusted stats like Sharpe, Sortino, volatility, drawdown, and CAGR so you can compare tokens objectively and build smarter bots and dashboards. In minutes, you’ll query /v2/quantmetrics, render a clear performance snapshot, and ship a feature that customers trust. Start by grabbing your key at Get API Key, Run Hello-TM to verify your first call, then Clone a Template to go live fast.
Risk-adjusted truth beats hype. Price alone hides tail risk and whipsaws. Quantmetrics compresses edge, risk, and consistency into metrics that travel across assets and timeframes—so you can rank universes, size positions, and communicate performance like a pro.
Built for dev speed. A clean REST schema, predictable latency, and easy auth mean you can plug Sharpe/Sortino into bots, dashboards, and screeners without maintaining your own analytics pipeline. Pair with caching and batching to serve fast pages at scale.
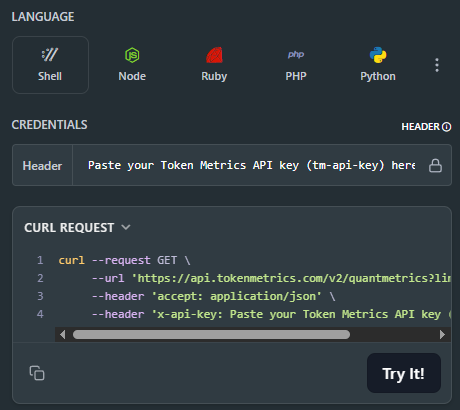
The Quant Metrics cURL request is located in the top right of the API Reference, allowing you to easily integrate it with your application.
👉 Keep momentum: Get API Key • Run Hello-TM • Clone a Template
Kick off from quickstarts in the docs—fork a dashboard or screener template, plug your key, and deploy in minutes. Validate your environment with Run Hello-TM; when you need more throughput or webhooks, compare API plans.
Quantmetrics computes risk-adjusted performance over a chosen lookback (e.g., 30d, 90d, 1y). You’ll receive a JSON snapshot with core statistics:
Call /v2/quantmetrics?symbol=<ASSET>&window=<LOOKBACK> to fetch the current snapshot. For dashboards spanning many tokens, batch symbols and apply short-TTL caching. If you generate alerts (e.g., “Sharpe crossed 1.5”), run a scheduled job and queue notifications to avoid bursty polling.
1) What does the Quantmetrics API return?
A JSON snapshot of risk-adjusted metrics (e.g., Sharpe, Sortino, volatility, max drawdown, CAGR) for a symbol and lookback window—ideal for ranking, sizing, and dashboards.
2) How fresh are the stats? What about latency/SLOs?
Responses are engineered for predictable latency. For heavy UI usage, add short-TTL caching and batch requests; for alerts, use scheduled jobs or webhooks where available.
3) Can I use Quantmetrics to size positions in a live bot?
Yes—many quants size inversely to volatility or require Sharpe ≥ X to trade. Always backtest and paper-trade before going live; past results are illustrative, not guarantees.
4) Which lookback window should I choose?
Short windows (30–90d) adapt faster but are noisier; longer windows (6–12m) are steadier but slower to react. Offer users a toggle and cache each window.
5) Do you provide SDKs or examples?
REST is straightforward (JS/Python above). Docs include quickstarts, Postman collections, and templates—start with Run Hello-TM.
6) Polling vs webhooks for quant alerts?
Dashboards usually use cached polling. For threshold alerts (e.g., Sharpe crosses 1.0), run scheduled jobs and queue notifications to keep usage smooth and idempotent.
7) Pricing, limits, and enterprise SLAs?
Begin free and scale up. See API plans for rate limits and enterprise SLA options.

In the fast-paced world of crypto, everyone’s chasing the next 100x altcoin. But with thousands of tokens launching every month—and scams lurking around every corner—it’s natural to ask: “Is Moonshot legit?”
In 2025, one platform has gained massive attention for its AI-powered ability to surface early-stage altcoins before they explode: Token Metrics Moonshots.
This article takes a deep dive into what Moonshots are, how they work, and whether they’re truly legit—or just another overhyped crypto tool.
A moonshot refers to a low-market-cap cryptocurrency with the potential to grow exponentially—sometimes delivering 10x, 50x, or even 100x returns.
Moonshots typically:
But identifying moonshots early is hard without deep technical knowledge, insider access, or hours of research—until Token Metrics came along.
Token Metrics Moonshots is an AI-powered feature inside the Token Metrics platform that uses real-time data and advanced machine learning to surface high-potential altcoins before they pump.
Unlike meme calls on Telegram or Twitter influencers shilling bags, Moonshots are backed by structured data and AI analysis.
Token Metrics makes finding potential 100x coins as easy as clicking a few buttons. Here’s the exact process:

Each Moonshot includes:
Want to know if the algorithm works? Toggle to Past Moonshots to track actual results over 7–14 days. Many have shown 3x–9x returns in just a few days.
Token Metrics shows the live performance of every current and past Moonshot. You can verify:
This transparency builds trust. You’re not guessing—you’re measuring results.
Most “100x picks” online are based on hype or paid promotions. Moonshots are based on data—real metrics like:
That means no emotion, no bias, no hidden agendas.
In 2025, Moonshots helped users catch tokens before they were listed on major exchanges. Real examples from Q2 2025 include:

All of these were surfaced by Moonshots before they appeared in trending lists or news headlines.
Token Metrics is a well-known crypto research platform used by retail and institutional investors alike. Its tools have been featured in:
The Moonshots feature is just one layer of a larger AI analytics platform that includes:
If you’re already using Token Metrics, Moonshots is the fastest way to find early-stage altcoins backed by AI research.
No. Like any strategy in crypto, not every Moonshot performs. But the system is designed to identify tokens with strong probability of breakout, not guarantees.
That’s why you should:
In 2025, AI is outperforming human traders in speed, objectivity, and signal processing. Token Metrics trains its models on thousands of historical and real-time data points—delivering consistent, data-driven picks without emotional bias.
Moonshots are available on the Advanced Plan and higher. You can start with a 7-day free trial to test it out yourself.
Yes—Token Metrics Moonshots is a legit, AI-powered discovery tool for finding early-stage altcoins before they go viral.
It’s not a guaranteed win button. But it levels the playing field, giving everyday users access to tools once reserved for hedge funds and crypto insiders.
If you're tired of missing the next big altcoin pump or relying on influencer tips, Moonshots gives you back control—backed by real data.
Set custom alerts to get notified of new Moonshots

In mid‑2025, the crypto market is surging. Bitcoin (BTC) has blasted past $118,000, Ethereum (ETH) is over $3,000, and altcoins like XRP, ADA, and DOGE are back in focus. There’s one source powering many traders’ forecasts: Token Metrics, a leading AI‑driven crypto research and prediction platform. This extensive 1500‑word guide takes you through price forecasts, key drivers, risks, and how Token Metrics helps you stay ahead.
Before the altcoin specifics, it’s crucial to note that many digital assets are moving in tandem with Bitcoin. Token Metrics issued a bullish signal on Bitcoin on June 28, which quickly propelled BTC past the $110,000 resistance—a breakthrough that underscores fresh institutional momentum and on‑chain supply dynamics.

Token Metrics predicts $150,000–$230,000 range by 2026, averaging around $190,000, based on its AI model factoring in ETF flows, macro sentiment, and supply‑side trends.

If Bitcoin stays strong, Token Metrics forecasts ETH testing $5,000 to $10,000 by year‑end.

Bullish scenario: $5–$7 before year‑end, boosting to $10 if Bitcoin remains strong and the bullish momentum holds.
If ADA breaks $0.80, Token Metrics predicts $1.10–$1.65 by year‑end. Key zones:

With predictions like this, it’s essential to choose a research tool that delivers accuracy, objectivity, and automation. Token Metrics ticks every box:

We're witnessing one of the most powerful crypto bull cycles since 2021. Institutional capital, macro turbulence, and smart contract expansion are fueling gains across the board.
But this isn't about blind optimism—it's about precision entry, objective signals, and dynamic portfolio management.
That’s why Token Metrics stands out. Its AI forecasting platform offers tools that help investors:
Whether you're trading Bitcoin, Ethereum, or altcoins, Token Metrics equips you with tools to stay ahead. From real‑time signals, AI-predicted price targets, and custom alerts, to developer‑grade APIs, Token Metrics delivers a comprehensive crypto edge.
👉 Sign up now and level‑up your crypto portfolio strategy: tokenmetrics.com

Cryptocurrency is no longer just a buzzword — it’s a financial revolution. Since Bitcoin's creation in 2009, digital currencies have disrupted traditional finance, creating an entirely new class of assets. But what exactly is cryptocurrency, how does it work, and how can investors navigate this complex market with the help of tools like Token Metrics?
This comprehensive and SEO-optimized guide explains what cryptocurrency is, how it works, the different types available, and how platforms like Token Metrics help investors make smarter, AI-powered decisions.
Cryptocurrency is a digital or virtual form of money that uses cryptography for security. Unlike traditional fiat currencies like the U.S. Dollar or Euro, cryptocurrencies operate on decentralized networks — typically blockchain technology — that aren't controlled by governments or central banks.
At the heart of cryptocurrency is blockchain technology — a distributed ledger that records all transactions across a network of computers (called nodes). Each block contains a list of transactions, and once verified, it's added to the chain permanently.
If Alice sends 1 Bitcoin to Bob, this transaction is verified by nodes and added to the Bitcoin blockchain. No bank is involved, and no one can alter the record.
Thousands of cryptocurrencies exist today, but they typically fall into these categories:
The original and most well-known cryptocurrency. It's often viewed as "digital gold" due to its scarcity and store-of-value properties.
Any crypto that's not Bitcoin. Examples include:
Digital assets pegged to fiat currencies. Example: USDT (Tether), and USDC. These offer price stability and are widely used for trading and DeFi.
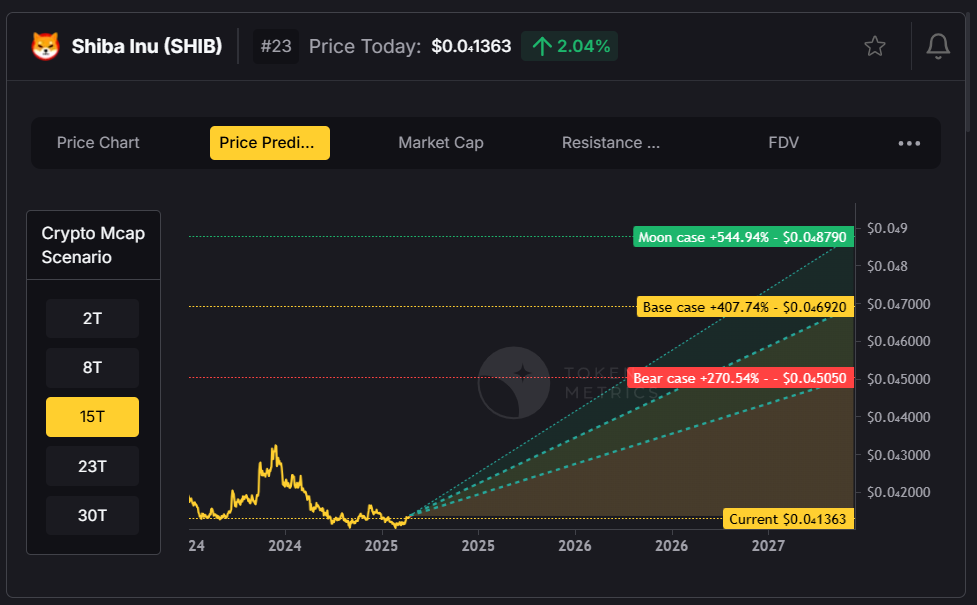
Tokens like Dogecoin (DOGE) or Shiba Inu (SHIB), driven largely by community hype and social media.
Tokens used within specific platforms, such as BNB for Binance or TMAI for Token Metrics.
Given the complexity and volatility of crypto, using a data-driven platform like Token Metrics can make a huge difference.
Token Metrics is an AI-powered crypto analytics and investment research platform that helps investors:
Token Metrics uses machine learning to forecast future price ranges for Bitcoin, Ethereum, and 6,000+ altcoins.
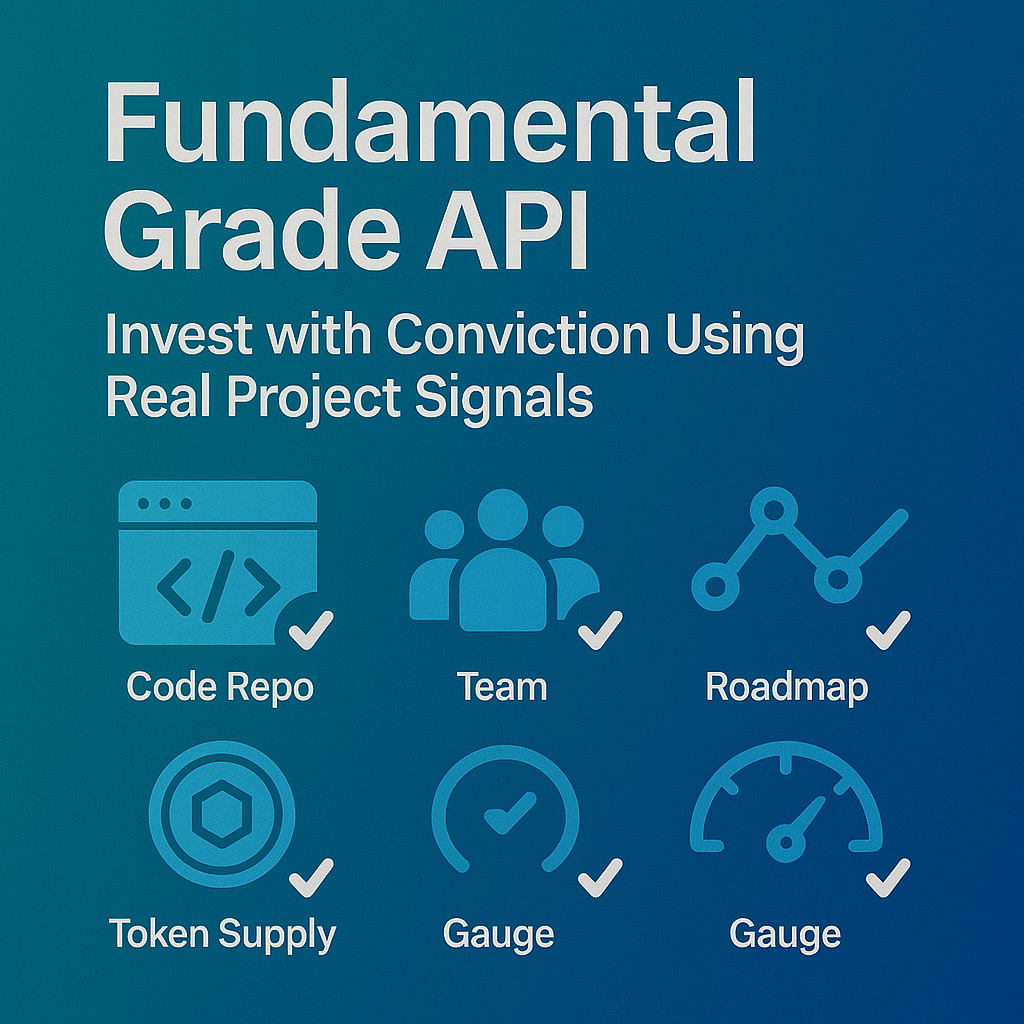
Each token is assigned a Trader Grade (short-term performance) and an Investor Grade (long-term fundamentals), updated daily using 80+ on-chain, technical, and sentiment data points.
Discover small-cap tokens with massive upside using the Moonshots tab, ranked by ROI, volume, grade changes, and time of entry.
Receive instant alerts via Telegram, email, Discord, or SMS for:
Dive deep into any project — fundamentals, top holders, historical grades, AI forecasts, and charting — all in one place.
Once you’ve done your research, trade instantly through Token Metrics with integrated swap functionality.
Step 1: Sign Up for Free
Visit tokenmetrics.com and choose a plan. Free users get 5,000 API calls per month and access to basic analytics.
Step 2: Visit the Ratings Page This page ranks top-performing coins using AI grades and recent performance metrics.
Step 3: Click on Moonshots Looking for the next 100x gem? The Moonshots tab highlights tokens with exceptional short-term upside potential.
Step 4: Set Custom Alerts
Never miss a breakout. Customize alerts for price changes, grade shifts, or buy/sell signals.
Step 5: Explore Deep Research
Use Token Metrics’ detailed pages to analyze tokenomics, volume, investor behavior, and social sentiment.
Cryptocurrency is rapidly evolving. With institutional adoption rising, central banks exploring CBDCs, and retail interest growing, the market is entering a more mature phase.
Key trends:
Platforms like Token Metrics will become essential as investors need intelligent, unbiased tools to navigate this increasingly sophisticated market.
Cryptocurrency is changing how we think about money, ownership, and investing. But with great opportunity comes complexity. Whether you're a beginner or a seasoned trader, tools like Token Metrics give you the edge you need to:
Token Metrics isn’t just a research platform — it’s your AI-powered co-pilot in the crypto space.
%20Price%20Prediction%202025_%20Can%20the%20Meme%20Coin%20Hit%20%241.25%20This%20Bull%20Cycle_.png)
As of July 2025, Dogecoin (DOGE) is once again in the spotlight—trading near $0.20, its highest level in over a year. Powered by Bitcoin’s rally past $112,000, renewed interest from Elon Musk, and increasing institutional attention, DOGE is gaining bullish momentum. But can the original meme coin hit $1.00 or beyond in this bull cycle?

In this highly informative and SEO-optimized blog post, we break down the catalysts, technical setup, and risk factors for Dogecoin in 2025. Most importantly, we’ll explore how Token Metrics’ AI price prediction tools can help investors navigate the volatility and time DOGE trades with precision.

Bitcoin’s price blasting through $112,000 has triggered broad bullish sentiment across altcoins—especially meme tokens like DOGE. In every prior bull market, DOGE has benefited from retail euphoria and momentum trading when Bitcoin leads the charge.
With Bitcoin and Ethereum ETFs approved, attention is turning to the next wave of altcoin ETFs. Analysts believe:
Elon Musk remains one of Dogecoin’s biggest champions, now using DOGE as a payment option across:
His social media engagement continues to drive waves of DOGE buying—creating short-term surges and long-term loyalty.
More online platforms are integrating DOGE as a payment method. This includes:
Merchant adoption reinforces DOGE’s use case as a fast, low-fee transactional token.
On-chain data shows:
These are classic signals of a trend reversal and long-term bullish setup.
Based on fundamentals, on-chain metrics, and sentiment, here’s a breakdown of DOGE’s projected price scenarios:

Key Resistance to Break: $0.20, $0.30
Short-Term Support: $0.15
Critical Support: $0.12
Despite its meme coin charm, Dogecoin is not without risks:
Unlike Bitcoin, DOGE has no hard cap. It adds 5 billion DOGE per year, which:
DOGE relies heavily on social media buzz, influencer tweets, and trending memes. While this fuels rallies, it also:
Compared to Ethereum or Solana, DOGE lacks:
This limits its utility beyond payments and speculation.
With such a volatile asset, traders need more than gut feelings—they need data-backed predictions, AI-generated signals, and real-time alerts. That’s where Token Metrics shines.
Token Metrics uses deep learning models trained on:
These models provide short- and long-term predictions for DOGE—helping investors spot trends before they go viral.

DOGE signals on Token Metrics are updated daily and triggered by:
This gives traders a clear view of when to enter and exit—not based on hype, but on quantified momentum.
Each token—including DOGE—receives:
DOGE’s Trader Grade often spikes during retail-driven rallies, helping you catch the wave early.
DOGE’s Token Page on Token Metrics offers:

It’s the ultimate dashboard for anyone actively trading Dogecoin.
Never miss a DOGE breakout again. Token Metrics lets you:
It’s like having an AI trading assistant for DOGE, 24/7.
The answer depends on:
With a bullish setup in place and key macro trends aligned, DOGE hitting $0.55 to $1.25 by Q4 2025 is within reach.
But volatility will remain high—so timing, data, and discipline are critical.
Whether you’re a meme coin enthusiast or a data-driven trader, DOGE in 2025 presents real profit potential—especially with the right tools.
With Token Metrics, you can:
👉 Start your free trial at tokenmetrics.com
🚀 Explore the DOGE token page, check signal history, and set your moonshot alerts.
%20Price%20Prediction%202025_%20Can%20ADA%20Break%20%241.50%20This%20Bull%20Cycle_.png)
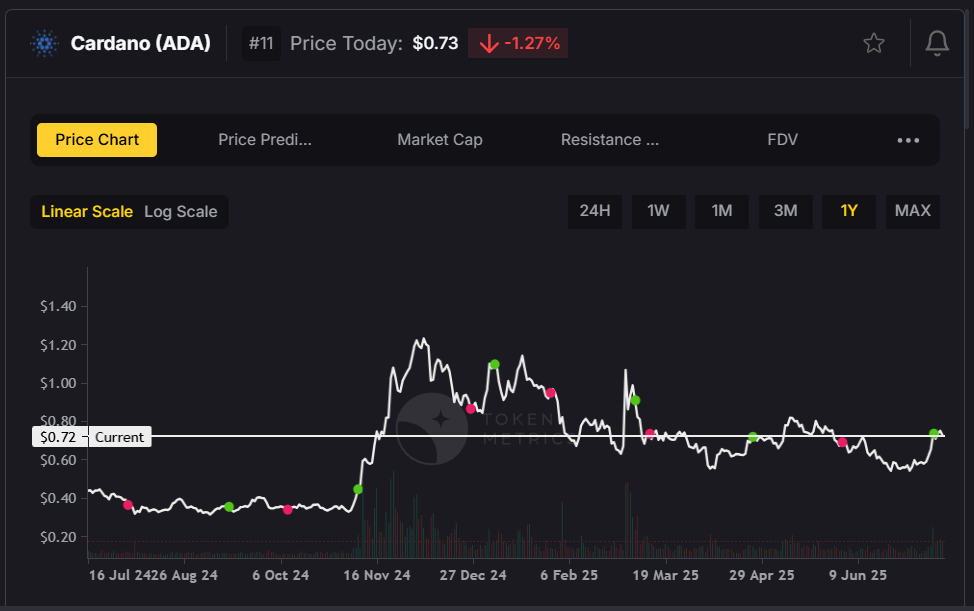
As of July 12, 2025, Cardano (ADA) is showing renewed strength, climbing toward the critical $0.75 resistance level as Bitcoin soars above $112,000. After months of consolidation, the smart contract platform is gaining attention from investors, driven by key upgrades, growing DeFi activity, and a broader crypto bull market.
But can ADA reclaim the $1.00 milestone—or even surge beyond $1.50—by the end of the year?
In this highly informative and SEO-optimized article, we’ll explore Cardano’s 2025 price outlook, fundamental drivers, potential risks, and how Token Metrics’ AI tools can help you make smarter, data-backed investment decisions.

The Plomin Hard Fork, implemented in Q1 2025, marked a turning point in Cardano’s evolution. It introduced:
This governance upgrade enhanced Cardano’s appeal to long-term investors and DeFi developers by aligning protocol evolution with community consensus.
Cardano’s DeFi ecosystem is gaining traction, with Total Value Locked (TVL) increasing by 21% since April. Leading protocols like Minswap, Indigo, and LiQwid have seen significant upticks in user activity and liquidity.
This growth signals:
Cardano could soon integrate Ripple’s newly launched $RLUSD stablecoin, offering:
Stablecoin adoption is a key growth driver for any Layer-1 network aiming to scale its DeFi infrastructure.
Cardano has attracted $73 million in institutional inflows in 2025 so far, according to data from leading asset managers. This shows:
With a 75% probability of ETF approval, institutional demand could surge further in Q4.
Analysts and machine learning models—including those from Token Metrics—project a bullish range for ADA in 2025, depending on technical and macroeconomic conditions.

Breakout Level to Watch: $0.80
Support to Hold: $0.62
Despite bullish fundamentals, Cardano still faces several challenges that could cap or delay price gains:
With only 30,000 daily active addresses, Cardano still lags behind competitors like:
Low user activity may:
Cardano must compete with:
ADA needs to differentiate itself with real-world adoption and enterprise use cases.
Even in a bull market, sharp corrections happen. ADA could:
In crypto’s high-volatility environment, AI-driven research tools are essential. Token Metrics empowers ADA investors with real-time signals, grades, and analytics to stay ahead of the market.
Token Metrics' machine learning models forecast ADA’s short- and long-term price movements based on:

These forecasts update in real time as market conditions evolve.
Grades are updated daily, providing clarity even during volatile market swings.
Token Metrics issues real-time bullish and bearish signals on ADA, helping users:
Each signal is backed by over 80 on-chain and technical data points.

ADA’s dedicated page includes:
It’s a comprehensive research hub for Cardano investors.
Set up personalized alerts for ADA based on:
Receive alerts via email, Discord, Telegram, or Slack, keeping you informed 24/7.
If ADA cannot break above $0.80, it may retrace toward:
In that case, investors should:
Cardano is making meaningful strides:
If these trends continue and Bitcoin remains in a bull cycle, ADA could reach $1.10–$1.65 by year-end.
However, investors should stay cautious of competition, user activity metrics, and potential volatility.
With Token Metrics, you can:
Ready to take advantage of Cardano’s potential?
👉 Visit tokenmetrics.com
🚀 Access AI price predictions, moonshot opportunities, and real-time signals
📲 Set custom alerts so you never miss a breakout
%20Price%20Prediction%202025_%20Will%20XRP%20Hit%20%2410%20This%20Bull%20Cycle_.png)
Ripple’s native token, XRP, is experiencing renewed momentum in 2025, surging to $2.58 and breaking the long-standing $2.50 resistance level. This price movement coincides with Bitcoin's rally past $112,000, signaling that XRP is riding the current bull market wave.
But what’s driving this surge in XRP? Is it sustainable? And could we see XRP hit $5, $7—or even $10—before the end of 2025?

In this highly informative and SEO-optimized blog post, we analyze the factors behind XRP’s rise, evaluate its future potential, and explain why Token Metrics’ AI-powered price prediction tools offer unmatched insights for crypto investors.
In July 2025, XRP’s breakout above $2.50 marks one of its strongest price performances since the 2017 bull run. Key drivers behind this bullish trend include:
Ripple finalized its years-long lawsuit with the U.S. Securities and Exchange Commission (SEC) by paying a $50 million settlement—without admitting XRP is a security. This outcome:
With the lawsuit resolved, XRP is now eligible for listings, ETF consideration, and greater adoption in regulated financial environments.
Ripple has successfully launched RLUSD, its native stablecoin backed 1:1 by U.S. dollars. RLUSD provides:
This ecosystem expansion strengthens Ripple’s value proposition and increases XRP utility and demand.
With Ethereum and Bitcoin ETFs already active, XRP is next in line. Analysts estimate:
ETF listings would make XRP easily accessible in retirement accounts, financial advisors’ portfolios, and wealth management platforms—further legitimizing the asset.
Ripple now boasts partnerships with 300+ financial institutions, including:
This positions XRP as a global standard for cross-border payments—a market worth $150+ trillion annually.
Analysts and AI models predict a strong upside potential for XRP during this bull cycle. Here's a breakdown of possible scenarios:

Breakout Level to Watch: $3.40
Support Level: $2.10
Despite the bullish momentum, XRP still faces several risks:
Although the SEC case is resolved, Ripple faces:
RLUSD must compete with:
Failure to achieve rapid RLUSD adoption could cap XRP's growth potential.
After explosive gains, whales may lock in profits, causing sharp pullbacks. Key support at $2.10 must hold to maintain bullish structure.
In a fast-moving market, investors need real-time, data-driven predictions—not guesswork. Token Metrics offers the most advanced tools for XRP investors.
Token Metrics uses machine learning models trained on years of crypto market data to generate high-accuracy price forecasts.
For XRP, these models consider:
The result? A forward-looking price forecast you can trust.
The Token Metrics platform issues real-time bullish or bearish signals based on:
These signals help you:
Token Metrics assigns every token—including XRP—a:
Both are AI-calculated using 80+ metrics, and they update daily. This helps you:
With Token Metrics, you can set personalized alerts for XRP:
Alerts are delivered via email, Slack, Telegram, or Discord—so you never miss a key movement.

The XRP profile page on Token Metrics provides:
Everything you need for informed XRP investing in one place.
While many altcoins are chasing narratives (AI, memecoins, DePIN), XRP’s case is fundamentally driven by:
Token Metrics’ crypto indices help investors diversify by creating thematic portfolios (e.g., “Institutional Adoption,” “Layer-1 Networks,” “Cross-Border Payments”)—with XRP often at the top of the cross-border category.

Corrections are part of every bull market. If XRP fails to hold above $2.50:
Use Token Metrics’ bearish signal alerts to de-risk in real time.
With legal clarity, a new stablecoin, ETF approval potential, and over 300 institutional partnerships, Ripple and XRP are in their strongest position in years.
If Bitcoin continues its uptrend and XRP breaks above $3.40, the next major rally could take it to $5–$10 by the end of 2025.
But success depends on regulatory support, stablecoin adoption, and institutional inflows—all factors Token Metrics tracks daily with precision.
👉 Start now at tokenmetrics.com and gain an edge in XRP trading and investing

Ethereum is once again at the center of attention in the crypto market. With its price surging past $3,000 and Bitcoin breaking above $112,000, many analysts now believe ETH could reach $5,000–$10,000 before the end of 2025.

This renewed momentum is backed by strong technical upgrades, institutional demand, and a thriving decentralized finance (DeFi) ecosystem. But can Ethereum overcome its challenges and hit a new all-time high? In this highly informative and SEO-optimized article, we’ll break down Ethereum’s 2025 price outlook—and show how Token Metrics’ AI-powered tools help investors track key price signals, monitor risk, and discover hidden opportunities.
Ethereum’s bullish breakout above $3,000 signals strong investor confidence. Several catalysts are driving this uptrend:

Ethereum’s highly anticipated Pectra upgrade is designed to improve scalability and transaction throughput. This upgrade will:
This scalability boost is expected to attract more developers, dApps, and users, further increasing demand for ETH.
Ethereum ETFs are gaining traction, with $12 billion in assets under management (AUM) as of July 2025. Major asset managers like Fidelity, BlackRock, and VanEck have brought ETH exposure to traditional finance.
These ETFs are:
Ethereum is now firmly on the radar of pension funds, family offices, and sovereign wealth funds.
Ethereum remains the undisputed leader in decentralized finance. As of July 2025:
Layer-2s help reduce fees, increase speed, and unlock new user growth. They are essential for Ethereum to scale while maintaining security.
With strong fundamentals, investor demand, and bullish momentum, here’s what analysts are forecasting:

Key breakout level to watch: $4,000
Key support level: $2,500
Despite bullish catalysts, Ethereum faces several potential headwinds that could slow or stall price growth:
Blockchains like Solana, Aptos, and Sui offer high-speed, low-cost alternatives. They continue to attract developers and DeFi projects due to:
Ethereum’s dominance could erode if it fails to keep pace with these innovations.
When usage surges, Ethereum gas fees can spike, pricing out retail users. This could limit dApp usage and reduce ETH demand during key moments in the bull cycle.
Though the U.S. has become more crypto-friendly, some regions still lack clear ETH guidance. New regulations affecting:
…could introduce market volatility.
In a market as fast-moving as crypto, investors need tools that offer real-time insights and predictive analytics. That’s where Token Metrics shines.
Token Metrics uses machine learning to forecast Ethereum’s short- and long-term price targets based on:
Its Ethereum model is continuously updated, adapting to market changes in real time.
These grades allow users to track Ethereum’s strength against thousands of other tokens.
Token Metrics issues daily buy/sell signals on Ethereum, helping users:
These signals are backed by AI algorithms that consider:
Set Ethereum alerts by:
Get alerts via email, Telegram, Discord, or Slack—so you never miss a trade.
Get all key ETH metrics in one place:
All powered by Token Metrics’ AI research engine.
To forecast Ethereum demand, investors should track:
Token Metrics includes Layer-2 project ratings and staking-related altcoin analysis for advanced users.
While $5,000–$10,000 is possible, ETH could face a correction if:
In that case, ETH could fall back to $2,500–$2,800, a key demand zone.
Token Metrics’ alerts and AI models help users manage risk and spot early trend reversals.
Ethereum has everything going for it in 2025:
If macro conditions remain favorable and Bitcoin sustains its rally, Ethereum could realistically test $10,000 before the end of the year.
But crypto markets remain volatile. Investors should use AI tools like Token Metrics to:
Ready to invest in Ethereum smarter?
👉 Sign up today at tokenmetrics.com and level up your crypto research game.

Cryptocurrency trading continues to evolve rapidly in 2025, driven by the rise of AI, automation, and real-time analytics. Choosing the right platform is critical to your success as a trader or investor. In this comprehensive guide, we’ll explore the top 5 crypto trading platforms in July 2025, explain what crypto trading is, discuss its different types, and show why Token Metrics stands out as the best AI-powered analytics and moonshot discovery platform.
Crypto trading involves buying and selling cryptocurrencies like Bitcoin (BTC), Ethereum (ETH), and thousands of altcoins on digital platforms to make a profit. Traders capitalize on price fluctuations by entering positions in the market—either manually or using automation.
Unlike traditional stock trading, crypto trading is:
There are several crypto trading strategies and approaches depending on your goals, risk tolerance, and available tools:
Buying and selling actual cryptocurrencies at current market prices. It’s simple and widely used by beginners.
Using borrowed funds to increase exposure. This amplifies gains but also increases risk.
Traders speculate on future prices using products like futures and options without owning the underlying assets.
A short-term strategy that aims to profit from small price movements—often requiring advanced bots or tools.
Holding a position for several days or weeks to capitalize on medium-term trends.
Using algorithms or AI to execute trades based on predefined strategies or signals.
Mimicking the trades of successful traders through social platforms.
Here are the best platforms based on performance, tools, security, and innovation:

Website: tokenmetrics.com
Token Metrics is not a traditional exchange but a powerful AI-driven analytics and trading platform. It helps users discover high-potential tokens, evaluate them using real-time data, and automate smarter trades.
Token Metrics empowers retail traders and institutional investors with AI precision, data transparency, and deep insights that traditional platforms simply don’t offer.
Why It Stands Out: No other platform blends AI-driven analytics, moonshot discovery, and real-time alerts with developer tools at this scale. It’s ideal for both hands-on traders and automated trading systems.

Website: binance.com
Binance is the largest centralized exchange by volume and offers extensive spot, margin, and futures trading. It supports hundreds of tokens and provides access to a robust launchpad, NFT marketplace, and staking.
Best For: Professional traders seeking high liquidity and advanced tools.

Website: coinbase.com
Coinbase is the go-to platform for beginners and U.S. traders. It provides an intuitive interface, secure storage, and educational resources.
Best For: Beginners and passive investors in regulated regions.

Website: kraken.com
Kraken is known for its strong security protocols and staking services. It offers spot, margin, and futures trading with a reputation for transparency.
Best For: Traders prioritizing security and staking rewards.

Website: bitget.com
Bitget is gaining popularity for its copy trading features and derivatives market. It allows users to replicate the trades of successful investors automatically.
Best For: Passive traders and futures enthusiasts.
While exchanges like Binance and Coinbase focus on execution, Token Metrics gives you the intelligence to know what to trade and when. Its AI-powered platform serves as the brain behind your trades—scanning thousands of tokens daily and distilling actionable insights in real time.
Whether you want to:
…Token Metrics is the most powerful analytics and trading assistant available in 2025.
Choosing the best crypto trading platform depends on your trading style and goals. For execution, Binance and Coinbase remain strong contenders. But if you're looking to gain an unfair advantage through AI, automate your workflow, and catch the next 10x altcoin before the crowd, Token Metrics is unmatched.
As AI continues to reshape crypto in 2025, platforms like Token Metrics will become the go-to infrastructure for intelligent investing. Don’t just trade crypto—trade with insight.

In the world of crypto, everyone dreams of discovering the next moonshot—that early-stage altcoin with the potential to deliver 10x, 50x, or even 100x returns. But finding the right token is only half the battle. The real key to success lies in your trading strategy—knowing when to buy, when to hold, and when to sell.
In this highly informative and SEO-optimized guide, we'll walk you through a proven crypto moonshot trading strategy using AI-powered buy/sell signals, real-time metrics, and automated tools. Whether you're a beginner or an experienced trader, this guide will help you maximize profits and reduce risks in 2025’s volatile crypto markets.
A crypto moonshot is an early-stage cryptocurrency with high upside potential—typically characterized by:
Moonshots are not just about luck—they require precise timing, data-driven decisions, and a disciplined trading strategy.
While moonshots offer huge potential returns, they also come with extreme volatility. Without a clear entry and exit strategy, traders risk:
That’s why successful moonshot trading is all about executing at the right moment, based on real-time buy and sell signals.
Buy/sell signals are automated indicators based on technical analysis, AI modeling, and data trends. When applied to moonshots, they help traders:
Token Metrics—one of the top AI crypto analytics platforms in 2025—offers integrated buy/sell signals as part of its Moonshots feature.
Token Metrics uses artificial intelligence to monitor over 6,000 tokens and identify daily Moonshots—early-stage tokens with exceptional upside potential. Each token is scored using over 80 data points, including:
The platform then issues Bullish (buy) and Bearish (sell) signals to help traders time their entries and exits more precisely.
Here’s a structured approach to building a winning moonshot trading strategy using Token Metrics:

✅ Pro Tip: Combine Bullish signals with a recent Moonshot entry (within the past 3 days) for the best short-term upside potential.
Token Metrics continuously analyzes live data. If momentum starts to fade, the platform may issue a Bearish Signal, suggesting it's time to exit.
There are two ways to exit your moonshot trade:
✅ Pro Tip: Combine both methods—sell early if a Bearish Signal appears, or scale out using a profit-taking ladder.
Even with powerful tools, moonshot trading is high-risk. Follow these tips to protect your capital:
Never go all-in on a single Moonshot. Spread your bets across multiple tokens to increase your odds of success.
Set a stop loss between 20%–30% below your entry price to prevent major drawdowns.
Use Token Metrics’ Past Moonshots view to study which tokens succeeded and what signals preceded them.
Use custom alerts to get notified when:
Token Metrics integrates with:
In 2025, crypto markets are more efficient than ever. Random guessing and influencer hype don’t cut it anymore.
To win, you need:
✅ Smart discovery
✅ Timely entries
✅ Strategic exits
✅ Reliable signals
With Token Metrics Moonshots and AI-powered buy/sell signals, you get the full toolkit to trade early-stage altcoins with confidence. It’s the edge every trader needs in the age of intelligent automation.
🧠 Trade smarter, not harder


 Create Your Free Account
9450 SW Gemini Dr
PMB 59348
Beaverton, Oregon 97008-7105 US
.svg)


.png)
Token Metrics Media LLC is a regular publication of information, analysis, and commentary focused especially on blockchain technology and business, cryptocurrency, blockchain-based tokens, market trends, and trading strategies.
Token Metrics Media LLC does not provide individually tailored investment advice and does not take a subscriber’s or anyone’s personal circumstances into consideration when discussing investments; nor is Token Metrics Advisers LLC registered as an investment adviser or broker-dealer in any jurisdiction.
Information contained herein is not an offer or solicitation to buy, hold, or sell any security. The Token Metrics team has advised and invested in many blockchain companies. A complete list of their advisory roles and current holdings can be viewed here: https://tokenmetrics.com/disclosures.html/
Token Metrics Media LLC relies on information from various sources believed to be reliable, including clients and third parties, but cannot guarantee the accuracy and completeness of that information. Additionally, Token Metrics Media LLC does not provide tax advice, and investors are encouraged to consult with their personal tax advisors.
All investing involves risk, including the possible loss of money you invest, and past performance does not guarantee future performance. Ratings and price predictions are provided for informational and illustrative purposes, and may not reflect actual future performance.


%20Price%20Prediction%20.webp)


%20Price%20Prediction.webp)


