


.png)


.png)
.png)


.png)


.png)
%201%20(1).png)

.png)


.png)


.png)
.png)


.png)


.png)

.png)
.png)
.png)
.png)
.png)
.png)
.png)
.png)
.png)


.png)


.png)

.png)
.png)


.png)


.png)
.png)
.png)
.png)

.png)
.png)


Research
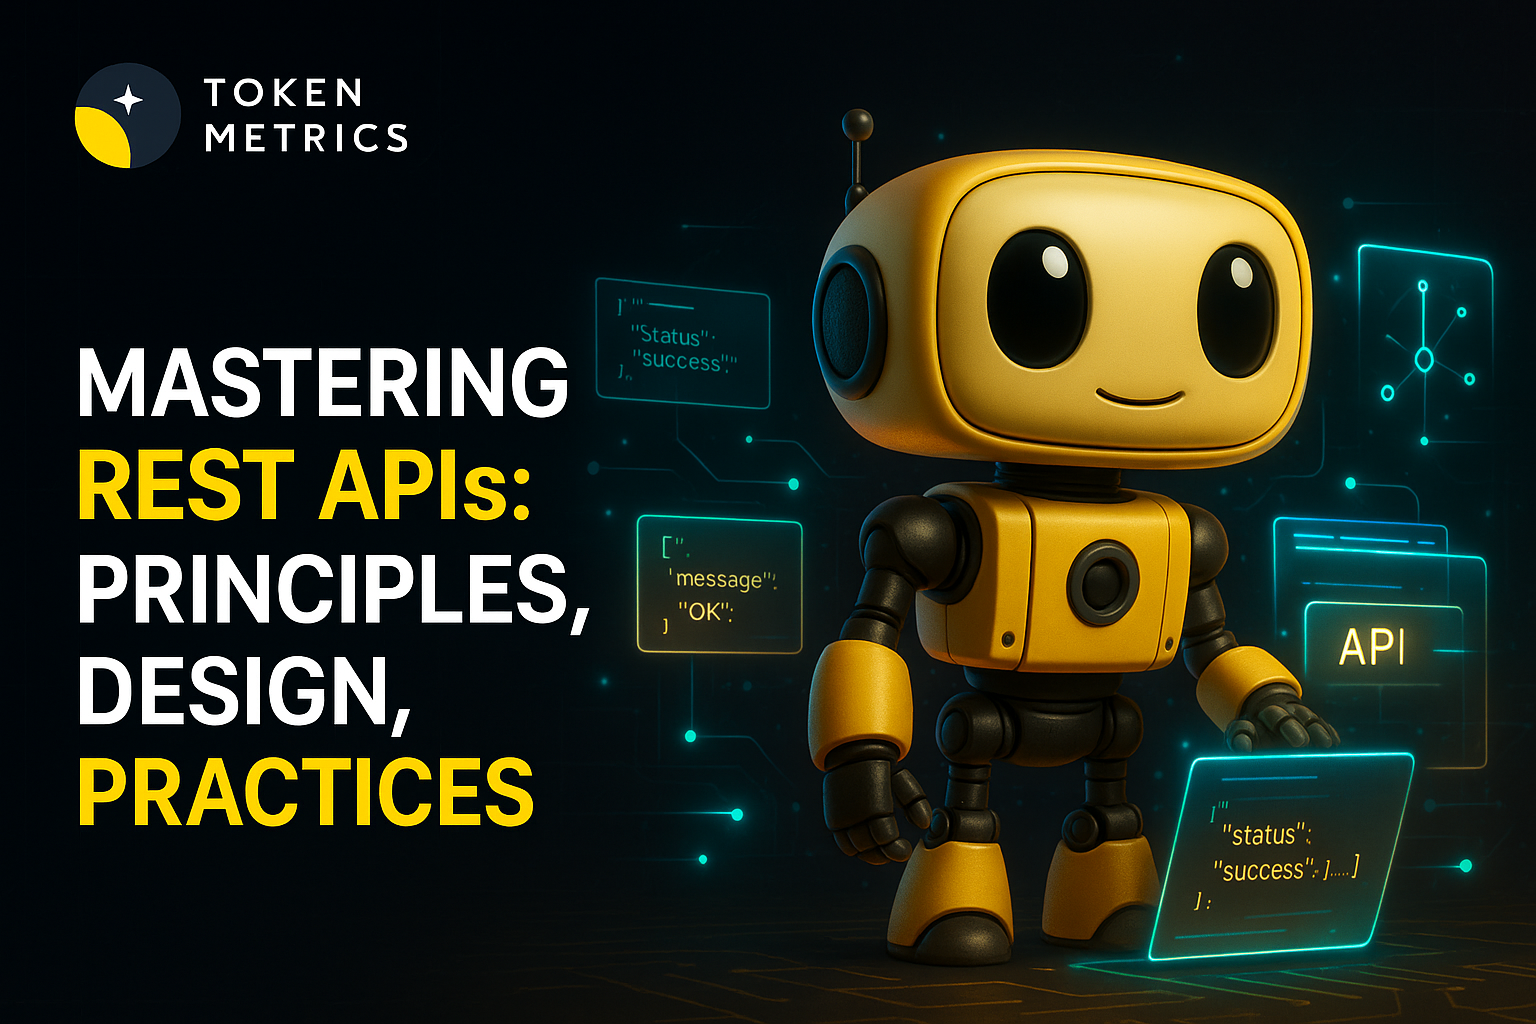
Top Crypto Trading Platforms in 2025
When it comes to crypto trading platforms, Token Metrics is not an exchange, but a crypto analytics and crypto trading intelligence platform powered by AI.
Token Metrics Team
10 min


%201.svg)
%201.svg)
Big news: We’re cranking up the heat on AI-driven crypto analytics with the launch of the Token Metrics API and our official SDK (Software Development Kit). This isn’t just an upgrade – it's a quantum leap, giving traders, hedge funds, developers, and institutions direct access to cutting-edge market intelligence, trading signals, and predictive analytics.
Crypto markets move fast, and having real-time, AI-powered insights can be the difference between catching the next big trend or getting left behind. Until now, traders and quants have been wrestling with scattered data, delayed reporting, and a lack of truly predictive analytics. Not anymore.
The Token Metrics API delivers 32+ high-performance endpoints packed with powerful AI-driven insights right into your lap, including:
Getting started with the Token Metrics API is simple:
At Token Metrics, we believe data should be decentralized, predictive, and actionable.
The Token Metrics API & SDK bring next-gen AI-powered crypto intelligence to anyone looking to trade smarter, build better, and stay ahead of the curve. With our official SDK, developers can plug these insights into their own trading bots, dashboards, and research tools – no need to reinvent the wheel.
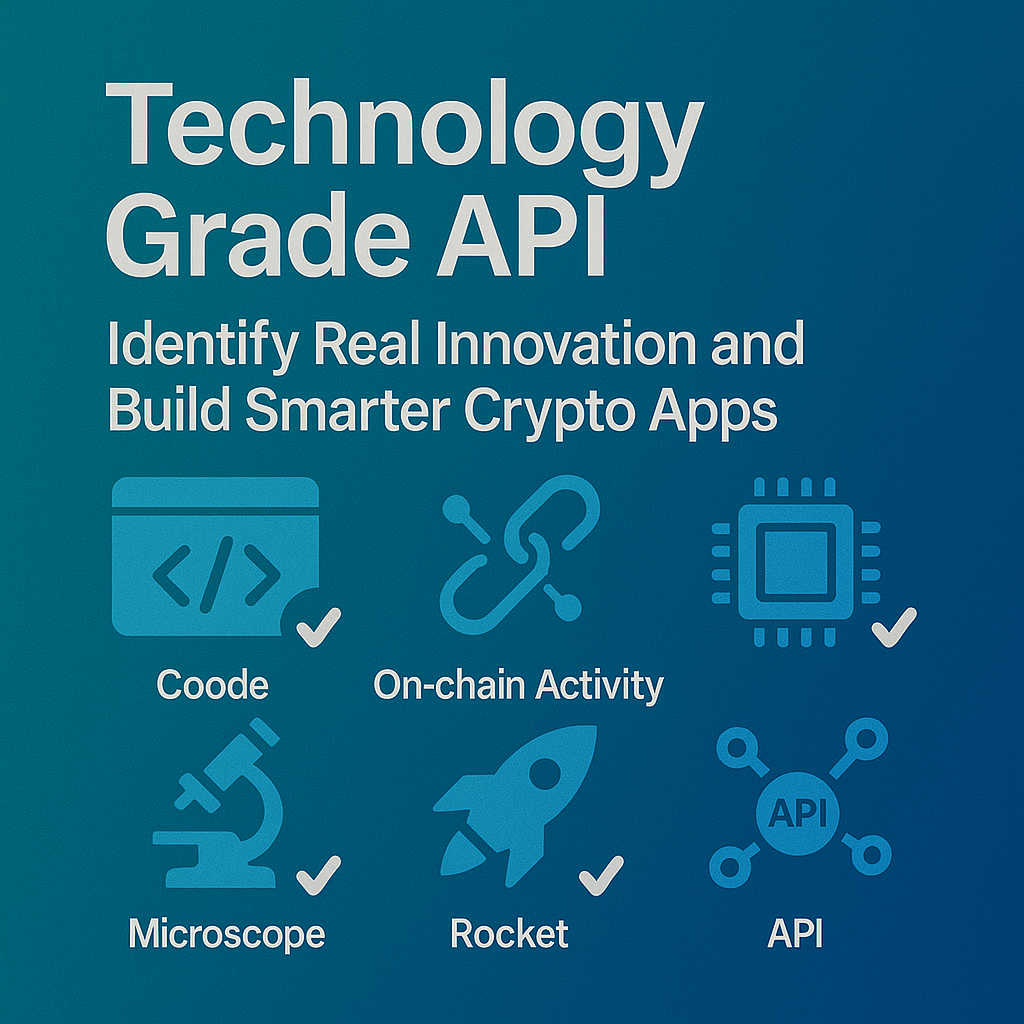
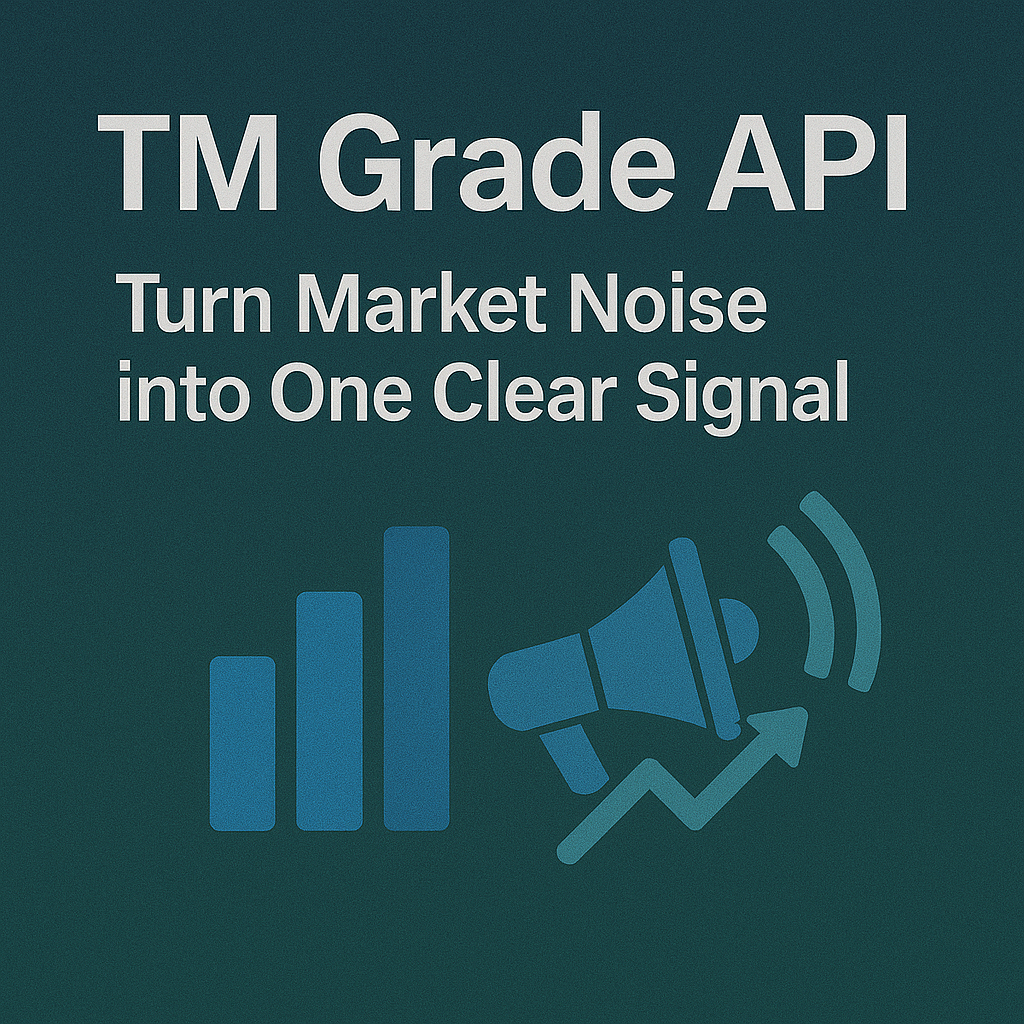
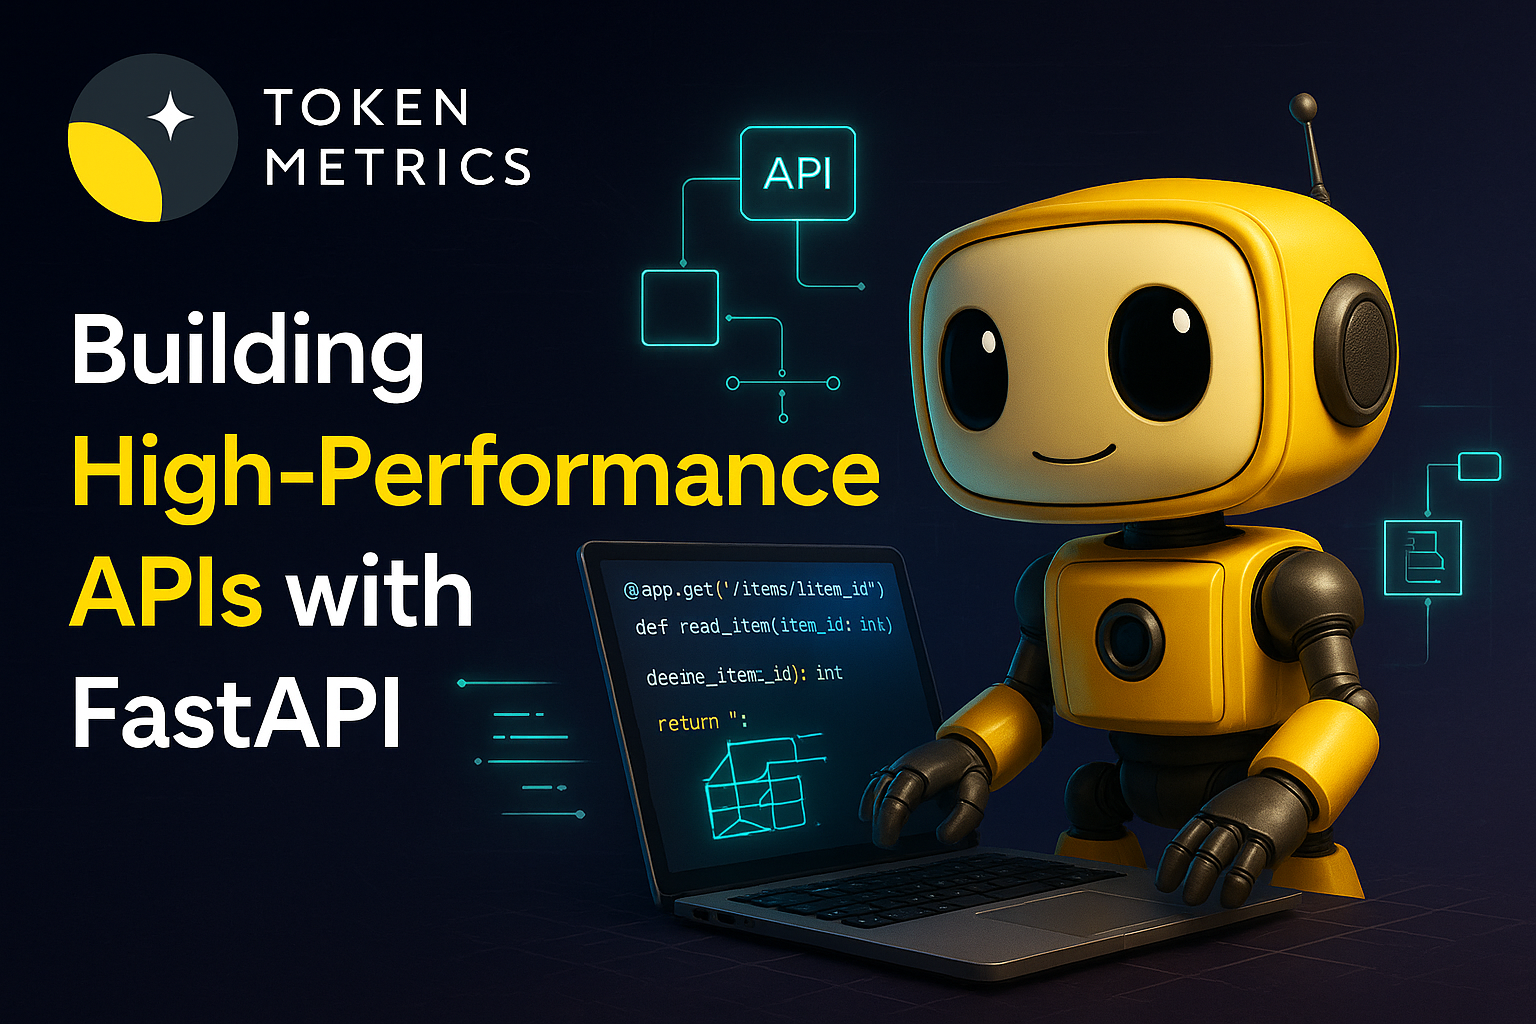
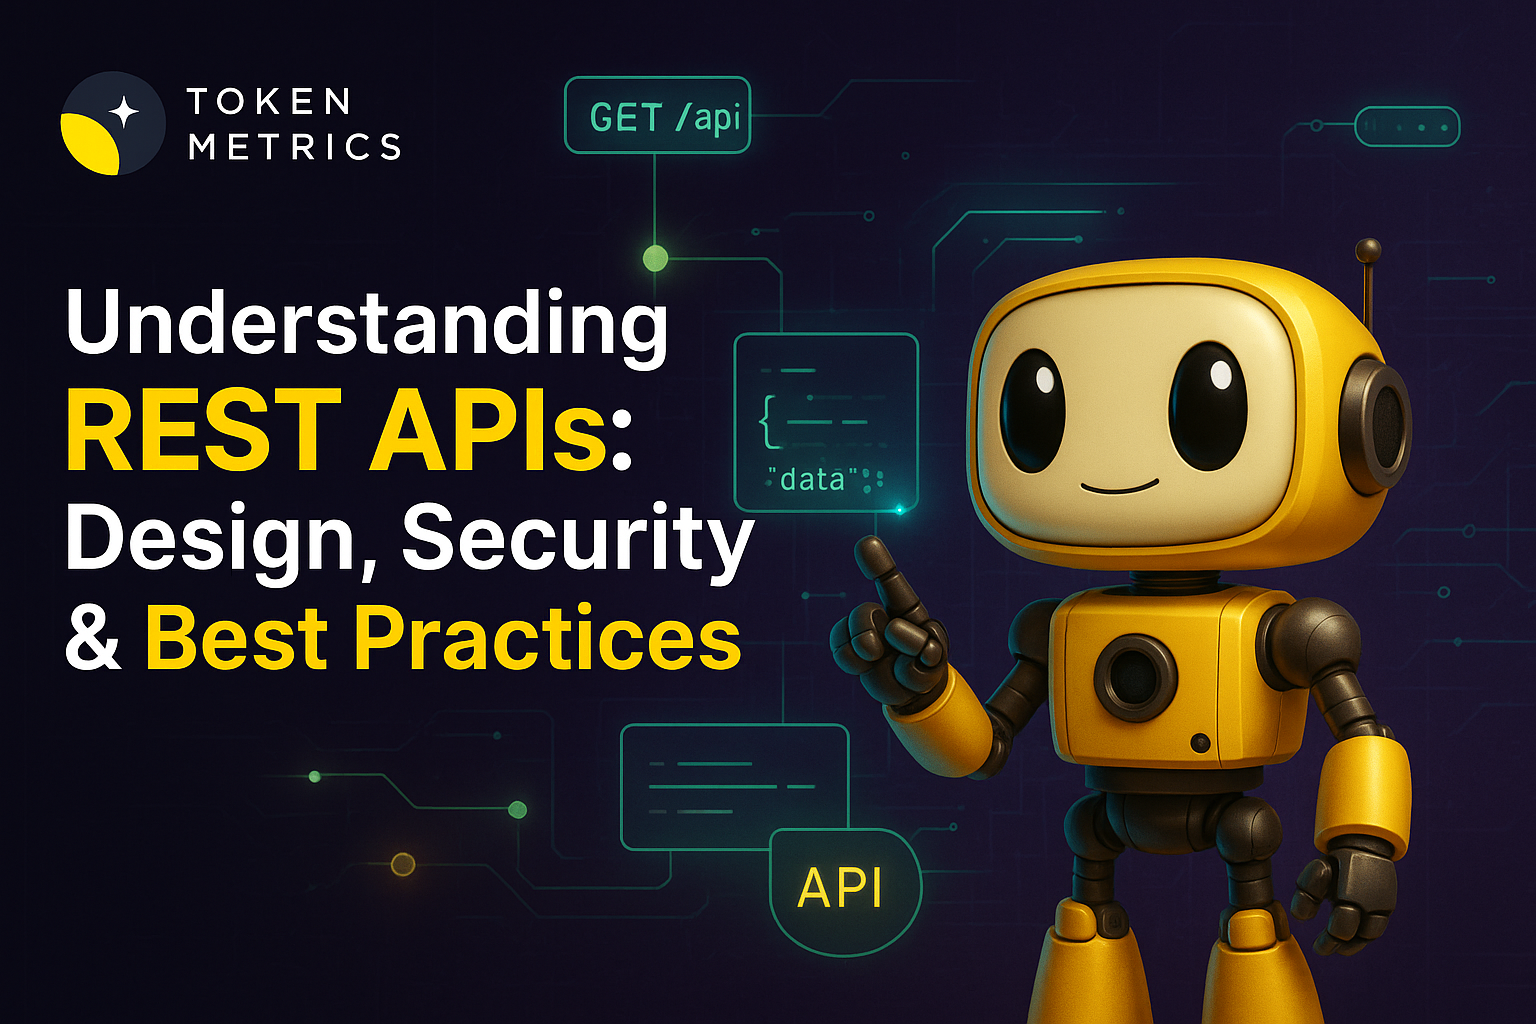
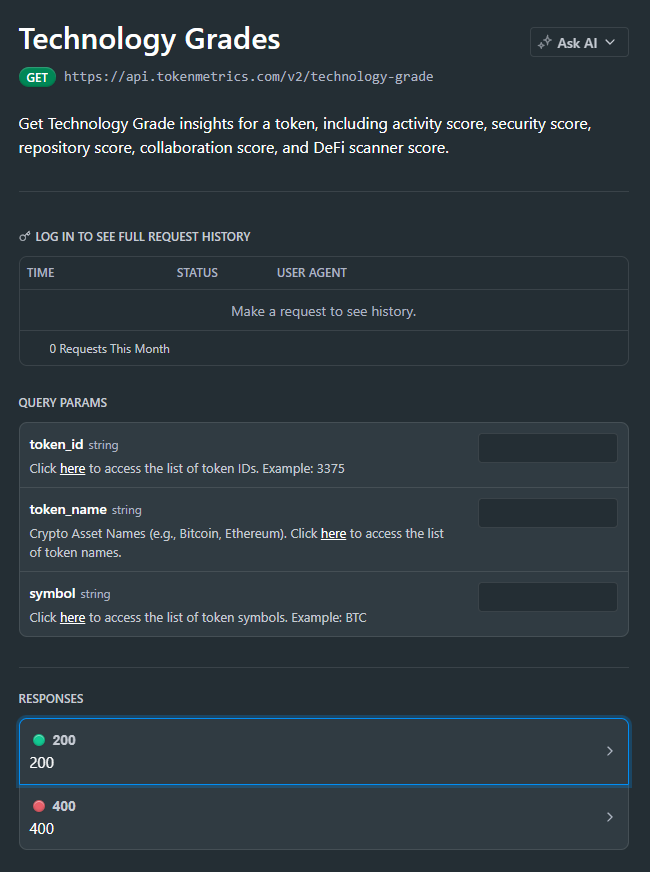
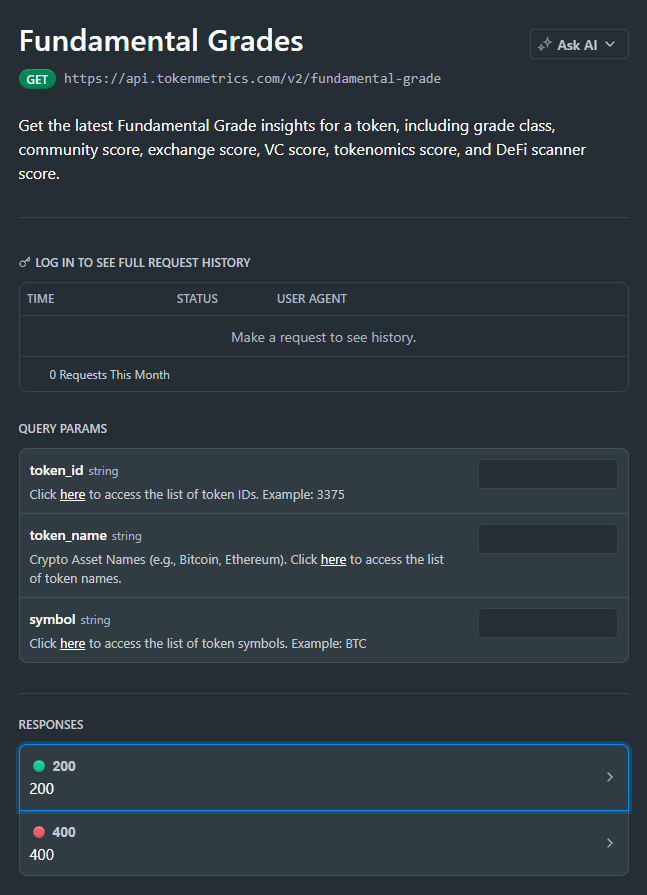
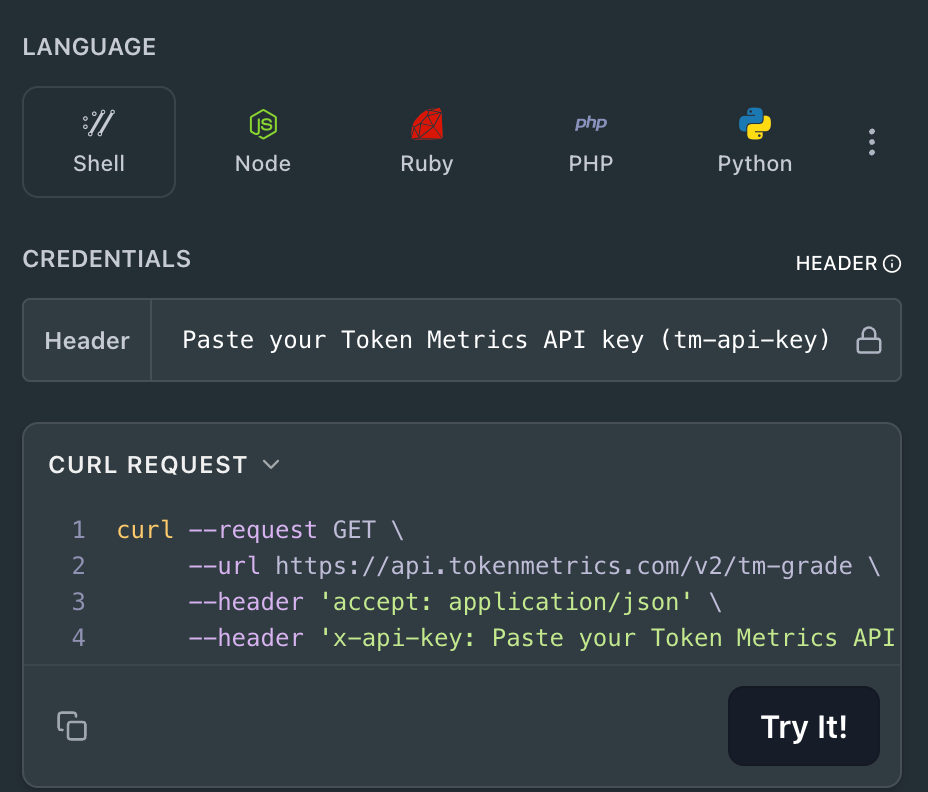
Hype is loud, but code is what lasts. The Technology Grade API helps you measure the engineering strength behind a token—scalability, innovation, and real code quality—so you can prioritize serious projects in your bots, dashboards, or research tools. In this guide, you’ll query the /v2/technology-grade endpoint, embed the score in your UI, and ship a feature that turns technical due diligence into a single actionable signal. Start by grabbing your key at Get API Key, Run Hello-TM to validate your first call, then Clone a Template to go live fast.
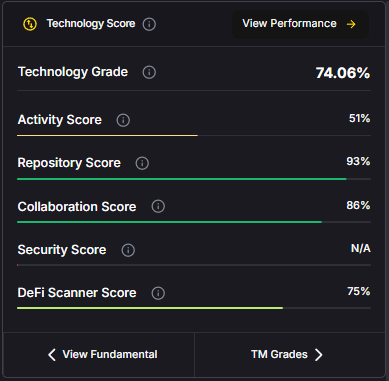
Separate hype from substance. Whitepapers and roadmaps are cheap; shipped code, throughput, and upgrade cadence are not. The Technology Grade API rolls engineering reality into a comparable score so you can rank ecosystems, filter listings, and surface projects with staying power.
Faster diligence, clearer decisions. For bot builders, Technology Grade is an upstream filter that keeps low-quality projects out of your universe. For dashboard builders, it adds credibility—users can see why a project ranks well. And for screeners, it’s a one-score signal that’s easy to sort, badge, and alert on with low latency.
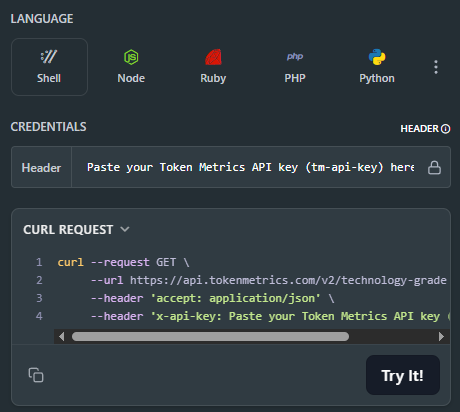
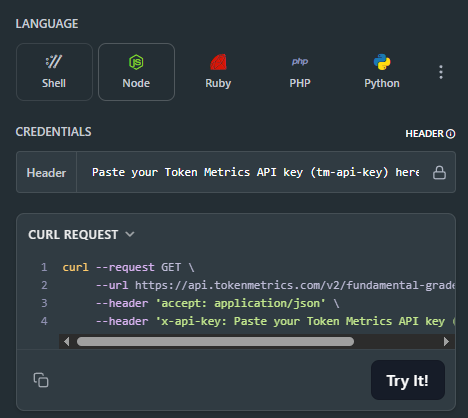
For the Technology Grade information, check the top right of the API Reference. You'll find the cURL request to connect effortlessly.
Kick off from quickstarts in the docs—fork a dashboard or screener and deploy. Validate your environment with Run Hello-TM, then scale usage. When you need higher limits and SLAs, compare API plans.
Technology Grade synthesizes engineering-centric evidence—such as throughput/scalability, rate of innovation (feature velocity, upgrade cadence), and code quality (maintainability, robustness cues)—into a normalized score and grade (e.g., Strong / Average / Weak). It’s designed to be comparable across projects and stable enough to inform filters, tiers, and badges.
At query time, you request /v2/technology-grade?symbol=<ASSET>. The response includes the headline score and component scores you can display in bars or a radar chart. For dashboards with many assets, use batched calls and short-TTL caching. If you push upgrade/downgrade alerts, queue notifications or use webhooks to avoid bursty polling.
1) What does the Technology Grade API return?
A JSON payload with an overall score/grade plus component scores (e.g., scalability, innovation, code quality) and timestamps. Use the overall score for ranking and components for explanation.
2) Is this real-time, and what about latency/SLOs?
The endpoint is engineered for predictable latency suitable for dashboards and filters. For frequent refresh or alerts, combine short-TTL caching with queued jobs or webhooks to minimize round-trips.
3) How should I combine Technology Grade with other signals?
A common pattern: Technology Grade (engineering quality) + Fundamental Grade (business quality) + TM Grade (technicals/sentiment) + Trading Signals (timing) + Support/Resistance (risk placement).
4) How “accurate” is Technology Grade?
It’s an opinionated synthesis of engineering evidence, not financial advice. Use it as part of a diversified framework; validate with your own backtests and risk controls.
5) Do you provide SDKs or examples?
You can integrate via REST (JS/Python examples above). The docs include quickstarts, Postman collections, and templates—start by Run Hello-TM.
6) Polling vs webhooks for grade changes?
For UI pages, cached polling is fine. For alerts (upgrades/downgrades), prefer webhooks or scheduled jobs to avoid spiky traffic and rate-limit issues.
7) Pricing, limits, and enterprise SLAs?
Begin free and scale up as needed. See API plans for allowances; enterprise SLAs and support are available.
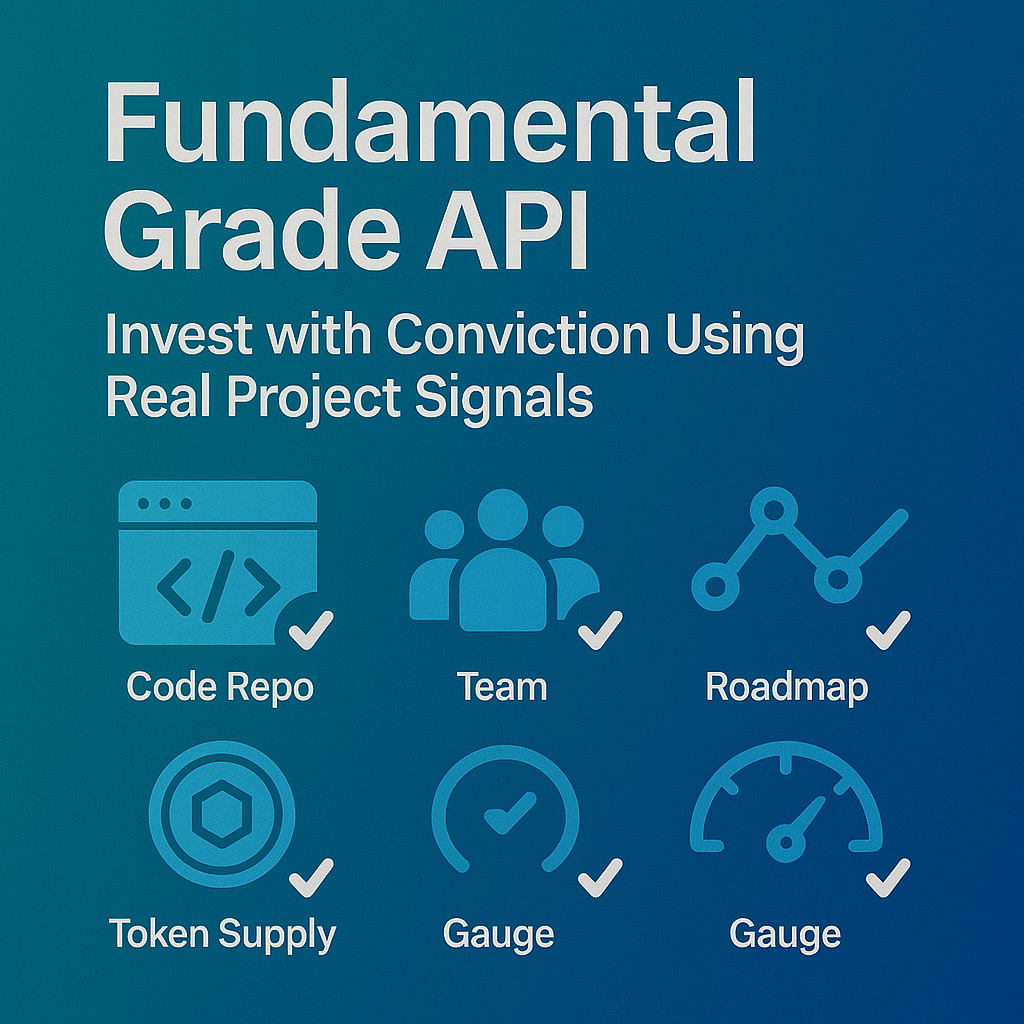
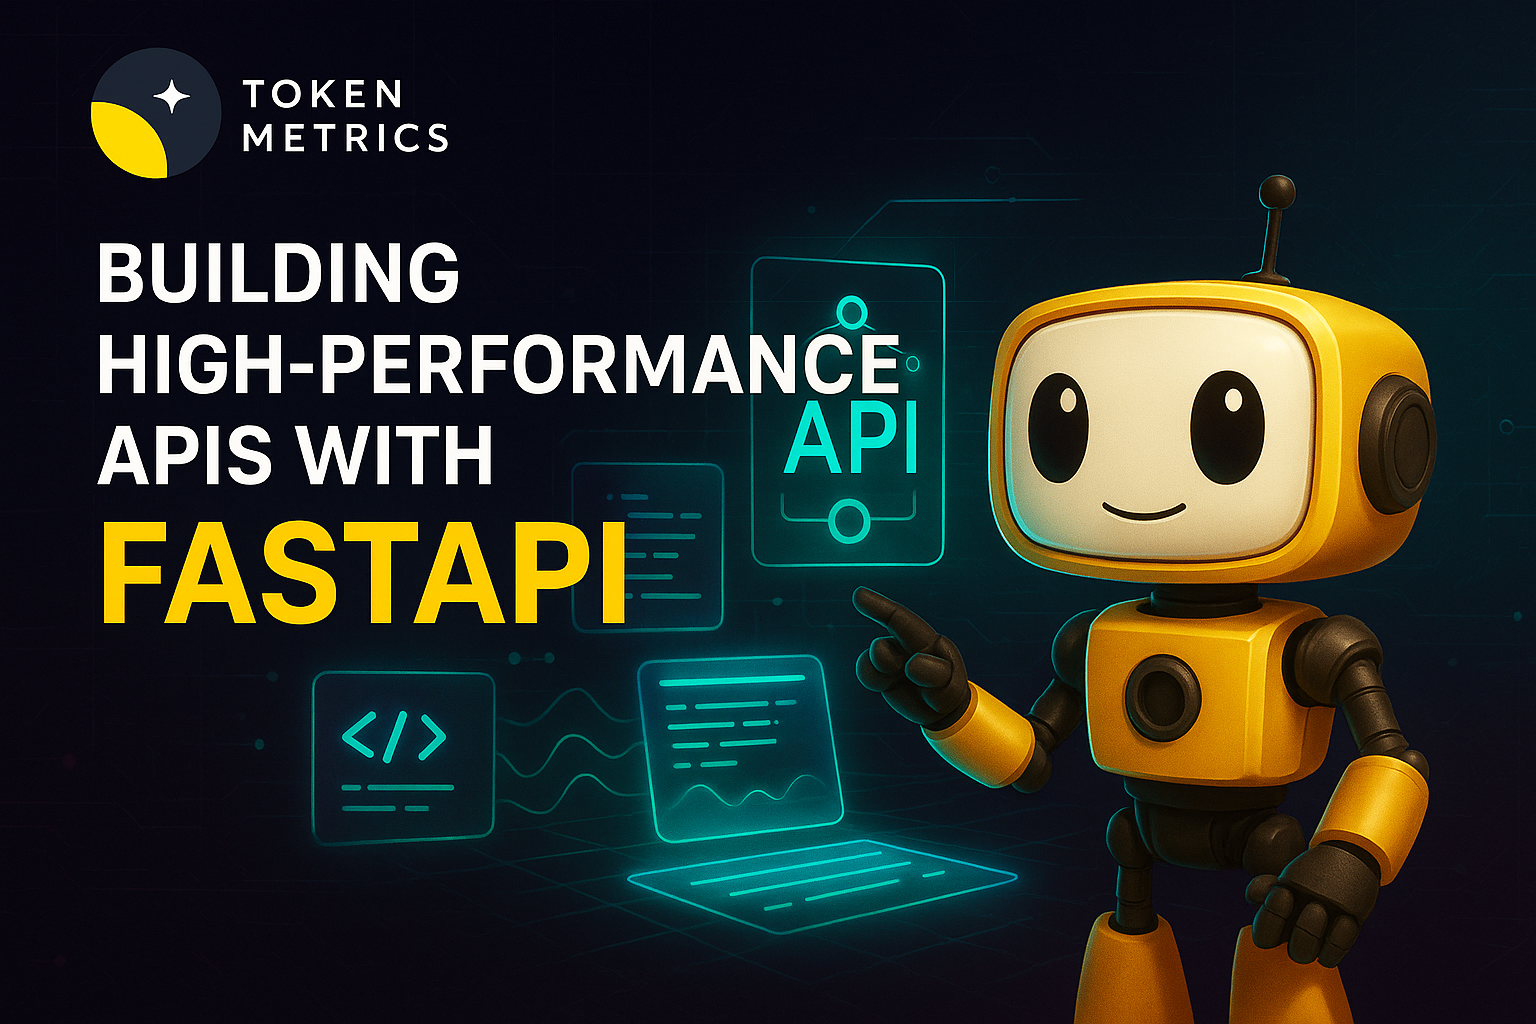
Most traders chase price action; Fundamental Grade API helps you see the business behind the token—community traction, tokenomics design, exchange presence, VC signals, and DeFi health—consolidated into one score you can query in code. In a few minutes, you’ll fetch Fundamental Grade, render it in your product, and ship a due-diligence UX that drives trust. Start by grabbing your key at the Get API Key page, Run Hello-TM to verify your first call, then Clone a Template to go live fast.
Beyond price, toward quality. Markets are noisy—hype rises and fades. Fundamental Grade consolidates hard-to-track signals (community growth, token distribution, liquidity venues, investor quality, DeFi integrations) into a clear, comparable score. You get a fast “is this worth time and capital?” answer for screening, allocation, and monitoring.
Build trust into your product. Whether you run an investor terminal, exchange research tab, or a portfolio tool, Fundamental Grade lets users justify positions. Pair it with TM Grade or Quantmetrics for a balanced picture: what to buy (fundamentals) and when to act (signals/levels).
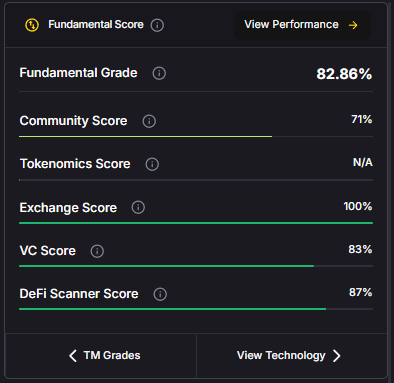
The Fundamental Grade is easily accessible in the top right of the API Reference. Grab the cURL request for seamless access!
👉 Ready to build? Get API Key • Run Hello-TM • Clone a Template
Kick off from our quickstarts—fork a dashboard or screener template, plug your key, and deploy. If you’re new here, Run Hello-TM first to confirm your environment, then scale into product features. When you outgrow the free tier, compare API plans.
Fundamental Grade aggregates multiple project-quality signals into a normalized score and label (e.g., Strong / Average / Weak). Typical sub-signals include:
At query time, you call /v2/fundamental-grade with a symbol; responses include the overall score plus component scores you can visualize. For dashboards with many assets, batch fetches and short-TTL caching keep pages responsive. If you push alerts (e.g., “Fundamental Grade upgraded”), prefer webhooks or queued jobs to avoid hammering the API.
1) What does the Fundamental Grade API return?
A JSON payload with the overall score/grade plus component scores (e.g., community, tokenomics, exchange presence, VC backing, DeFi health) and timestamps. Use the overall grade for ranking and component scores for explanations.
2) How fast is the endpoint? Do you publish SLOs?
The API is engineered for predictable latency. For high-traffic dashboards, add short-TTL caching and batch requests; for alerts, use jobs/webhooks to minimize round-trips.
3) Can I combine Fundamental Grade with TM Grade or signals?
Yes. A common pattern is Fundamental Grade for quality filter + TM Grade for technical/sentiment context + Trading Signals for timing and Support/Resistance for risk placement.
4) How “accurate” is the grade?
It’s an opinionated synthesis of multiple inputs—not financial advice. Historical studies can inform usage, but past performance doesn’t guarantee future results. Always layer risk management and testing.
5) Do you offer SDKs and examples?
You can use REST directly (see JS/Python above). The docs include quickstarts, Postman, and ready-to-clone templates—start with Run Hello-TM.
6) Polling vs webhooks for fundamentals updates?
For UI pages, cached polling works well. For event-style notifications (upgrades/downgrades), prefer webhooks or scheduled jobs to avoid spiky traffic.
7) What about pricing, limits, and enterprise SLAs?
Begin free and scale as you grow. See API plans for allowances; enterprise SLAs and support are available—contact us.
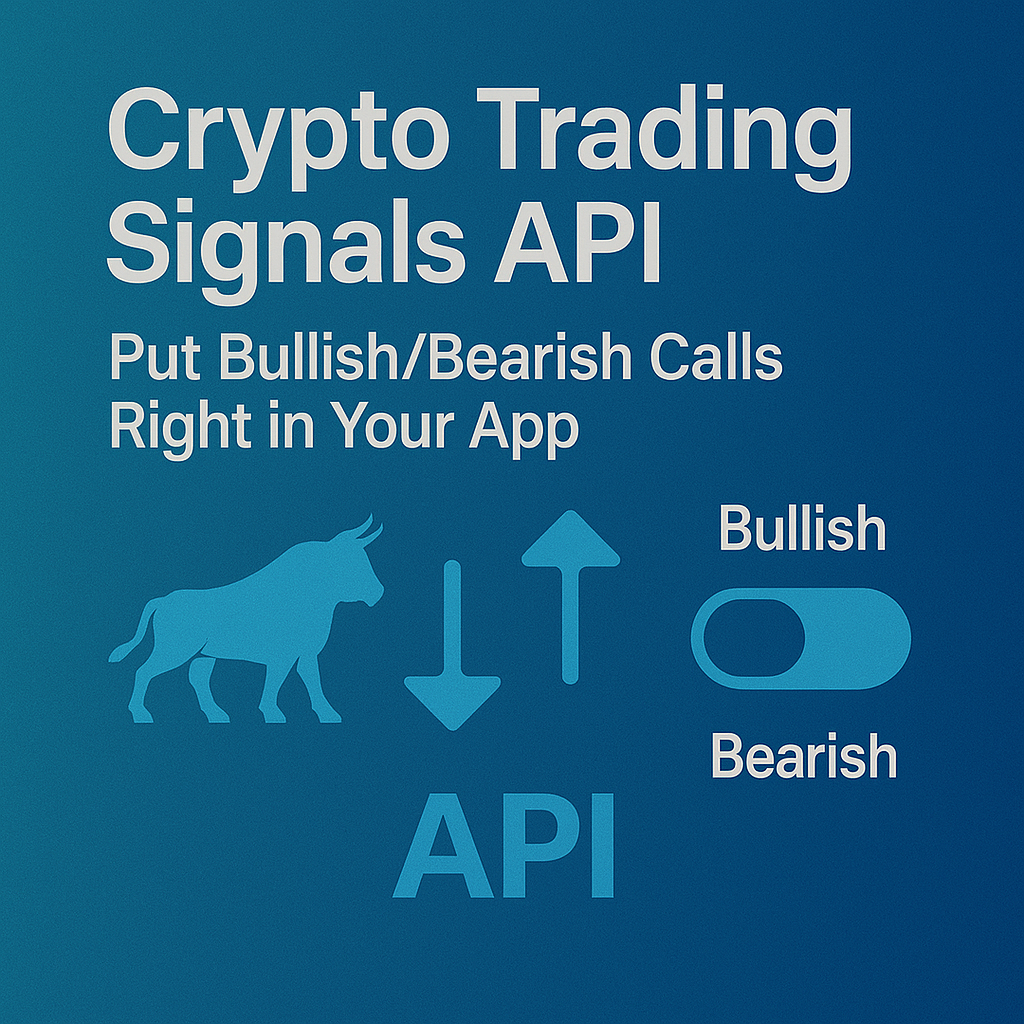
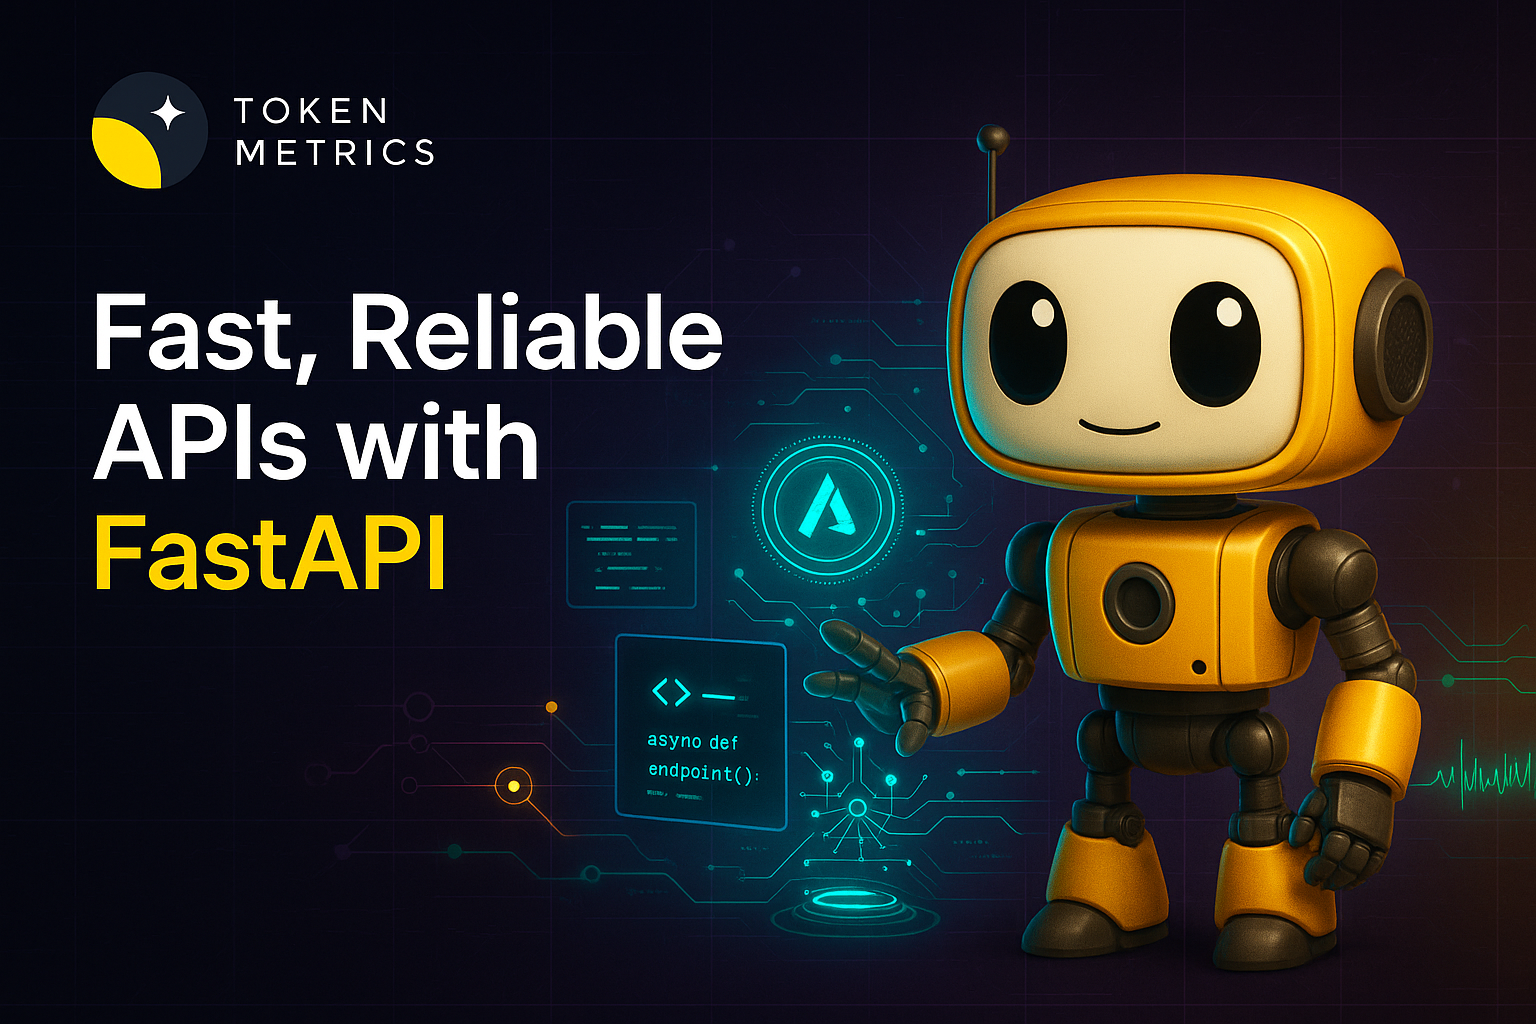
Cluttered charts and whipsaw price action make it hard to act with conviction. The TM Grade API turns that noise into a single, opinionated signal you can build on—ideal for trading bots, dashboards, and research tools. In this guide, you’ll pull TM Grade in code, see how it powers products, and ship something useful in minutes. Start with the Get API Key, then Run Hello-TM in the docs and Clone a Template to go live fast.
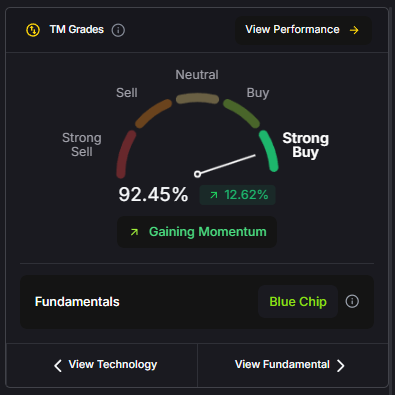
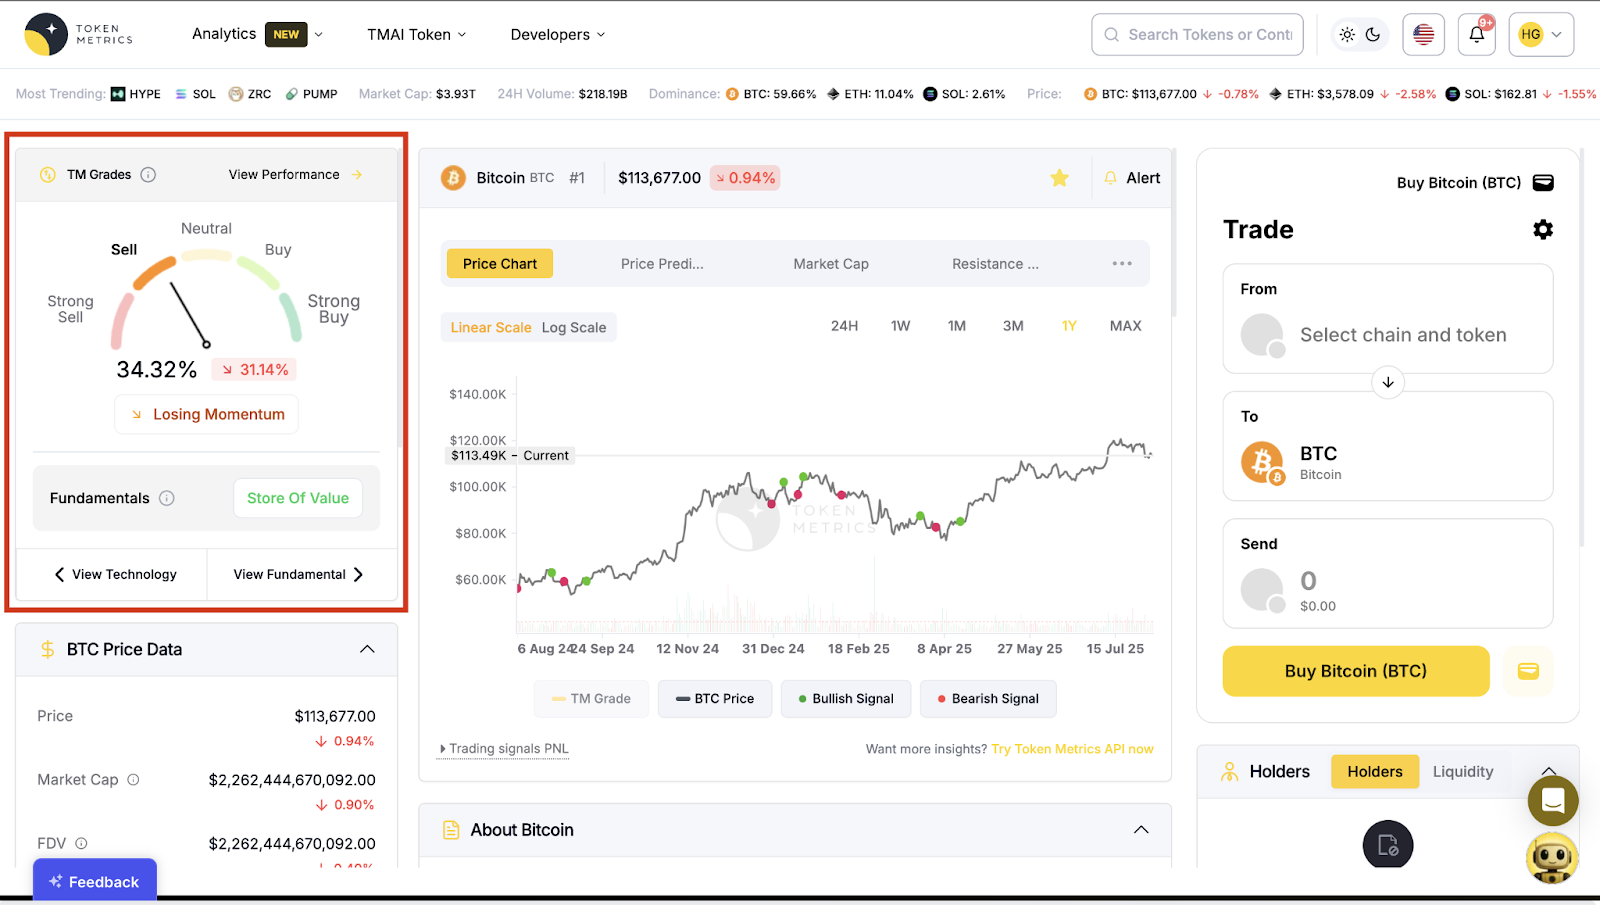
One score, clear decision. TM Grade distills technicals, sentiment, and momentum into a single, interpretable value from Strong Sell → Strong Buy. Instead of juggling indicators, you get an opinionated, trade-ready signal you can rank, alert on, and route into strategies.
Built for builders. Developers integrate TM Grade to filter universes, power dashboards, or trigger bots—with predictable performance and a schema designed for programmatic use. Pair it with webhooks and caching to slash latency and polling costs.
In the top right of the API Reference you can find the curl request for your desired language. This is what you can use to access the TM Grade endpoint.
👉 Ready to go further? Get API Key • Run Hello-TM
You can start from our quickstarts in the docs—fork, plug your key, and deploy in minutes. Run Hello-TM to see the first call succeed, then scale into a bot or dashboard. When you’re ready for higher limits, compare API plans.
TM Grade blends multiple evidence streams—technical momentum, market structure, sentiment, and other model inputs—into a single normalized score (e.g., 0–100) and a label (Strong Sell to Strong Buy). This opinionated synthesis is what separates TM Grade from raw market data: it’s designed to be actionable.
Polling vs webhooks. For screens and dashboards, lightweight polling (or cached fetches) is fine. For trading agents and alerting, use webhooks or short polling with backoff and caching to cut latency and call volume. Combine TM Grade with endpoints like /v2/trading-signals for timing or /v2/resistance-support for risk placement.
1) What does the TM Grade API return?
A JSON payload with fields like symbol, score (e.g., 0–100), and a categorical grade from Strong Sell to Strong Buy, designed for programmatic ranking, filtering, and display.
2) How fast is it? Do you have latency/SLOs?
TM endpoints are engineered for reliability with predictable latency. For mission-critical bots, add short-TTL caching and webhooks to minimize round-trips and jitter.
3) Can I use TM Grade in trading bots?
Yes. Many developers use TM Grade to pre-filter tokens and pair it with /v2/trading-signals for entries/exits. Always backtest and paper-trade before going live.
4) How accurate is TM Grade?
TM Grade is an opinionated model synthesizing multiple inputs. Backtests are illustrative—not guarantees. Use it as one component in a diversified strategy with risk controls.
5) Do you have SDKs and examples?
Yes—JavaScript and Python examples above, plus quickstarts and templates in the docs: Run Hello-TM.
6) Polling vs webhooks—what should I pick?
Dashboards: cache + light polling. Bots/alerts: prefer webhooks (or event-driven flows) to reduce latency and API usage.
7) Pricing, limits, and enterprise SLAs?
You can start free and scale up as you grow. See API plans for rate limits and tiers. Enterprise options and SLAs are available—contact us.

The crypto market moves fast. With thousands of new tokens launching weekly, finding legitimate crypto moonshots before they explode is nearly impossible for manual traders. Altcoin moonshots and meme coin moonshots can deliver 10x-100x returns, but only if you spot them early.
Most traders waste time scrolling through endless charts, following unreliable crypto influencers, and trying to interpret conflicting signals. They miss the best crypto moonshots because they lack proper token metrics analysis and end up buying the top instead of the bottom.
That's exactly why Token Metrics built Moonshots — your 24/7 AI researcher that identifies high-potential crypto opportunities using advanced token metrics analysis.
Token Metrics Moonshots is a daily AI-powered shortlist featuring the top crypto tokens with legitimate breakout potential. Unlike typical crypto signal groups, Moonshots uses institutional-grade AI to analyze:
The result? A curated daily feed of crypto moonshots that are actually moving, backed by comprehensive Token Metrics analysis.
Moonshots aren't based on hype or guesswork. Our AI system maintains a 65% historical win rate by analyzing:
Found a promising crypto moonshot? Execute trades instantly with integrated one-click trading. No platform switching, no missed opportunities — just seamless execution when altcoin moonshots and meme coin moonshots are ready to move.
Never miss another 10x opportunity. Moonshots delivers real-time alerts the moment new crypto moonshots are identified, ensuring you're always first to capitalize on emerging token metrics opportunities.
Our internal backtesting shows that compounding $1,000 using daily Moonshots picks with proper risk management could potentially grow to $30,000 in a year. This demonstrates the power of AI-vetted crypto moonshots over random trading.
Key success factors:
This isn't financial advice — it's AI-powered research giving you an edge most traders lack.
From your Token Metrics dashboard, navigate to the Ratings tab where all tokens are ranked by trader grade and recent performance metrics.
Inside the Ratings page, select the Moonshots tab to view current crypto moonshots and altcoin moonshots with breakout potential.
Each Moonshot displays crucial data:
Switch to "Past Moonshots" to review how previous crypto moonshots performed over 7-14 day periods.
Click any token to access its detailed page featuring:
Ready to buy? Click the "Buy" button directly from the Moonshots page to open the integrated swap widget and execute your crypto moonshots trades instantly.
Token Metrics Moonshots is designed for:
Token Metrics isn't just another analytics platform. We've built a comprehensive ecosystem combining:
Our Ratings, Grades, Indices, and Moonshots all serve one mission: help you profit from crypto moonshots with less effort and better results.
Everyone wants to catch the next 100x crypto moonshot, but most traders lack the tools to spot altcoin moonshots and meme coin moonshots early. Token Metrics Moonshots gives you that critical edge.
✅ Backed by AI with proven token metrics analysis
✅ Tested by data with 65% historical win rate
✅ Delivered daily with real-time alerts
✅ Integrated trading for instant execution
The next time a token moons, ask yourself: "Did I see this coming, or did I miss it again?"
With Token Metrics Moonshots, you'll be early — every time.
Moonshots is LIVE! Your first curated crypto moonshots picks are already waiting, complete with comprehensive token metrics analysis.
Ready to discover the next altcoin moonshots and meme coin moonshots before they explode?
👉 Click here to unlock Moonshots
Start trading smarter with AI-powered token metrics analysis. Let your AI researcher find the next crypto moonshot while you sleep.
Disclaimer: Cryptocurrency trading involves substantial risk. Past performance doesn't guarantee future results. Always conduct your own research and consider your risk tolerance before trading.

Cryptocurrency is one of the few markets where small investments can turn into life-changing gains—if you know where to look. The secret? Low cap altcoins with strong fundamentals, fresh narratives, and early momentum. These are often called moonshots—tokens that can 10x, 50x, or even 100x your portfolio.
But with thousands of projects launching every year, how do you separate noise from real opportunity?
This is where Token Metrics, the industry’s most powerful crypto analytics platform, gives you a massive edge. In this guide, you’ll learn exactly how to find high-potential low cap altcoins before they explode.
In crypto, a moonshot refers to a token that’s expected to deliver exponential returns—usually 10x or more—within a short to medium timeframe. These tokens often:
Moonshots are high-risk, high-reward plays. They may not have widespread recognition yet, but they often show early signs of momentum—and if timed correctly, they can outperform even the biggest names in crypto.
Moonshots usually follow a predictable cycle:
Savvy traders, insiders, or analysts begin accumulating the token quietly. There’s little public attention, but strong fundamentals or a promising narrative.
Something sparks attention—this could be an influencer tweet, exchange listing, or key milestone. Volume begins to rise.
Retail investors pour in as the token gains traction. Price rallies dramatically in a short period.
Early entrants sell, leading to price volatility. If the project has long-term merit, it may consolidate and rally again. If not, it could retrace sharply.
The goal is to get in early—before the FOMO begins. And that’s where Token Metrics shines.
Token Metrics is an AI-powered crypto research platform that filters through thousands of tokens daily to highlight only those with real upside potential. Its proprietary Moonshots feature is specifically designed to uncover undervalued low cap altcoins before they trend on X (Twitter), YouTube, or Telegram.
Token Metrics doesn’t just show you what's trending—it shows you what’s about to trend.
Here’s a step-by-step guide to using Token Metrics to discover low cap altcoins with maximum growth potential:

These scores are derived using over 80 data points, including:
At the top of the Ratings page, you’ll see the Moonshots tab—click it.
This tab highlights AI-flagged altcoins with breakout potential. These tokens are typically:
These are the best candidates for fast and explosive growth.
Each token in the Moonshots section displays several key data points:
You can also switch to the Past Moonshots tab to review historical picks and how they played out over 7–14 days. This transparency gives you confidence in the AI’s track record.
Click on any token to open its Token Details Page.
Here, you’ll get in-depth analysis, including:
Use this data to perform a quick due diligence check before buying. This helps reduce risk and boost conviction.
Once you’ve selected a moonshot you like:
This seamless flow—from research to execution—makes it incredibly easy to act quickly, which is crucial in fast-moving markets.
Here are just a few examples of tokens previously flagged in Token Metrics Moonshots:
These weren’t hyped on mainstream platforms—Token Metrics identified them early using AI-based indicators and on-chain data.
Finding low cap altcoins with maximum growth potential doesn’t have to be based on luck or hype. With the right tools, strategy, and platform, you can identify moonshots before they go parabolic.
Token Metrics Moonshots gives you the insights, data, and tools needed to make smarter, faster, and more confident trading decisions. From AI-powered ratings to seamless swap integration, it’s your all-in-one dashboard for finding the next big crypto opportunity.
So if you're serious about building wealth in the next bull run, don’t just follow the herd—get ahead of it.
🚀 Start your 7-day free trial at and unlock real-time access to Moonshots.

In the fast-paced world of crypto, finding an altcoin before it explodes is every investor’s dream. The reality? Most people arrive too late—after the hype, after the parabolic move, and after the gains are gone. But what if there was a way to spot these undervalued altcoins before they skyrocket?
In this guide, we’ll show you how to find 100x altcoins early using a proven strategy powered by Token Metrics Moonshot Ratings. Whether you're a seasoned trader or a curious beginner, this step-by-step framework will help you identify tokens that are flying under the radar—but not for long.
In crypto, a moonshot is a token with the potential to deliver extraordinary returns, sometimes as high as 100x or even 1000x. These tokens typically start with:
While some moonshots are driven by memes or hype, the best ones are backed by emerging narratives, strong tokenomics, and real momentum. The trick is to find them before they hit mainstream attention.
Moonshots follow a pattern:
Your goal? Enter in Phase 1 or early Phase 2, before everyone else sees the opportunity.
So how do you do that? With data—not hype.
Token Metrics is one of the most powerful AI-driven platforms for crypto research. It helps you filter out the noise and identify undervalued altcoins with moonshot potential based on over 80 data points including technicals, fundamentals, on-chain activity, and sentiment.
Here’s a step-by-step guide to using Token Metrics’ Moonshots feature:
Once you log in to Token Metrics, head over to the Ratings tab.
This is the heart of the platform, where every token is scored using:
You’ll see a ranked list of tokens with up-to-date analytics based on market behavior.
Tip: Sort by Trader Grade change to find tokens gaining momentum fast.
Inside the Ratings page, look for the Moonshots tab near the top.
This is where Token Metrics highlights altcoins with breakout potential, flagged by proprietary AI models that monitor price anomalies, trend shifts, volume surges, and social indicators.
Only tokens that meet strict short-term upside criteria make it into this section.
Each token in the Moonshots tab is presented with a powerful summary:
Want to verify the track record? Switch to “Past Moonshots” to see historical picks and their 7–14 day performance.
Click on a token to open its Token Details Page—this is where the real research begins.
You'll find:
This page helps you validate whether a moonshot token is worth the risk.
Is the project active on GitHub? Is the community growing? Are whales accumulating? All signs that a moonshot may be ready to launch.
Found a token you like?
Token Metrics makes it easy to act:
This removes friction and saves time, especially when speed is critical.
There are thousands of altcoins on the market—and most of them are noise. Token Metrics uses machine learning, real-time market signals, and historical backtesting to filter the noise and show you only the most promising tokens.
Whether you're a degen chasing 10x tokens or a professional building a data-backed portfolio, Token Metrics gives you the edge.
Finding undervalued altcoins that can 100x isn’t about luck—it’s about information, timing, and execution.
Moonshots happen often in crypto. The problem is: most people are late. By the time you see it trending on X or featured in a YouTube video, the gains are gone.
Using a platform like Token Metrics, you can identify these tokens early, analyze them with confidence, and take action fast—all in one place.
If you're serious about leveling up your crypto trading game, start with the Moonshots feature on Token Metrics. Your next 100x altcoin could already be on the list.
Sign up for a 7-day free trial at www.tokenmetrics.com and unlock your edge in crypto today.

In the world of crypto, timing is everything. If you’re trying to turn $100 into $10,000, the holy grail is finding the next 100x altcoin before the masses catch on. These explosive opportunities are rare, but with the right tools and strategy, they’re not impossible to uncover.
In this guide, we’ll show you exactly how to identify moonshot tokens—those under-the-radar gems that have the potential to skyrocket. You’ll also learn how to use Token Metrics, one of the most powerful AI-driven platforms, to spot them before they take off.
“Moonshot” is a crypto-native term that refers to a low-cap cryptocurrency with the potential to deliver outsized returns, often 10x, 50x, or even 100x. These tokens may start unnoticed, trading at fractions of a penny, but once they gain traction, they can make early adopters massive profits in a very short period of time.
Moonshots are risky—but with smart research and analytics, they can be strategic bets rather than blind gambles.
Most 100x altcoins follow a predictable life cycle:
Catching a moonshot before Step 3 is your goal. You want to be in position before the breakout, not chasing after it.
This is where Token Metrics becomes invaluable.
Token Metrics is a crypto analytics platform powered by AI, machine learning, and real-time data. It monitors thousands of tokens and ranks them using quantitative models, helping traders and investors find opportunities before they trend.
With features like:
…Token Metrics helps you act fast and stay ahead of the crowd.
Let’s walk through exactly how to use Token Metrics to find the next 100x cryptocurrency.
Here’s a step-by-step guide to using Token Metrics’ Moonshot system to uncover high-potential altcoins.
Once logged into the Token Metrics platform:
Trader Grade is especially important for short-term breakout potential—it reflects the strength of a token’s momentum and technical setup.
In the Ratings interface:
These tokens are selected using proprietary algorithms that scan for:
These are the coins flying just below the radar—with massive breakout potential.
Each token in the Moonshots tab includes real-time, high-signal data to guide your decision-making:
You can also switch to Past Moonshots to see historical performance. Many past Moonshots have shown gains of 3x–20x within days of being listed.
Click on any token from the Moonshots list to open its Token Details Page.
Here’s what you’ll find:
This is where you do your research. Look for projects with:
Once you’ve found a token you like:
This frictionless experience allows you to act immediately before the market catches on.
Finding the next 100x crypto is part art, part science. Here are a few tips to sharpen your strategy:
The next 100x altcoin won’t look obvious at first. It will likely be a small-cap token with limited press, an emerging narrative, and strong community energy.
By combining smart research, disciplined entries, and tools like Token Metrics Moonshots, you give yourself a major edge in spotting breakout coins before the explosion.
So stop guessing. Start using AI-powered insights to track moonshots, monitor early signals, and make informed trades that could change your portfolio—and your life.
🎯 Try Token Metrics now and unlock the Moonshots tab.
Visit: www.tokenmetrics.com

In the world of cryptocurrency, the term “moonshot” isn’t just slang—it’s the dream. A moonshot is that rare token that delivers 100x or even 1000x returns, turning small investments into massive profits. But the real question is: how do you find these altcoins before they explode?
In this guide, we’ll break down what moonshots are, how they work, and most importantly, how to use Token Metrics—the leading AI-powered crypto analytics platform—to discover hidden gems before the crowd catches on.
Moonshots are low market cap altcoins with high growth potential. These tokens often start under the radar, trading at fractions of a cent, and then experience explosive price action fueled by community hype, technical breakthroughs, or big news.
These tokens carry high risk but also high reward. Timing and information are everything—and that’s where Token Metrics comes in.
The mechanics behind a moonshot typically follow a cycle of accumulation, hype, breakout, and profit-taking:
Catching the token in Phase 1 or 2 is crucial. If you're entering during the parabolic move, the risk/reward ratio is much worse.
That’s why traders and investors rely on data and AI-powered tools like Token Metrics to identify moonshots before they explode.
Token Metrics offers a dedicated Moonshots feature powered by machine learning models trained on thousands of historical signals. It helps you find high-potential altcoins before they go mainstream.
Here’s a step-by-step guide to finding moonshot tokens using Token Metrics:
Trader Grade is especially important for identifying short-term opportunities and moonshot candidates.
Inside the Ratings page:
These are not random picks—they are selected based on:
The Moonshots page refreshes in real-time to capture fast-moving opportunities.
Each token listed in the Moonshots section includes crucial data to guide your decisions:
Want to see past winners? Just switch to “Past Moonshots” to view previous AI picks and how they performed over 7–14 days. Many tokens in this category have delivered 5x–20x returns in a matter of days.
Click on any token from the list to open its Token Details Page.
Here, you can:
This deep-dive view gives you everything you need to make an informed decision—not just guesswork.
Once you’ve done your due diligence:
This seamless process saves time and allows you to act quickly in a fast-moving market.
Finding 100x altcoins is about timing, data, and confidence. Token Metrics gives you all three:
No more relying on anonymous influencers or Telegram groups. Token Metrics backs every moonshot with quantifiable metrics.
The platform’s models constantly analyze price, volume, sentiment, and chain activity to spot anomalies and early breakouts.
You can review past Moonshots and their ROI—transparency that few platforms offer.
With integrated swap functionality, you can go from discovery to execution in under a minute.
Finding the next 100x altcoin is never easy—but with the right tools, your odds improve dramatically.
Moonshots are real, and they happen frequently in crypto. But they’re only lucrative if you find them early, analyze them rationally, and manage your risk.
With Token Metrics, you don’t have to chase hype—you can rely on real-time analytics, AI-powered ratings, and actionable insights to guide your moonshot hunting.
If you're serious about catching the next 100x gem, start using Token Metrics today.
🚀 Start your free trial and unlock the Moonshots tab at TokenMetrics.com
Introduction:
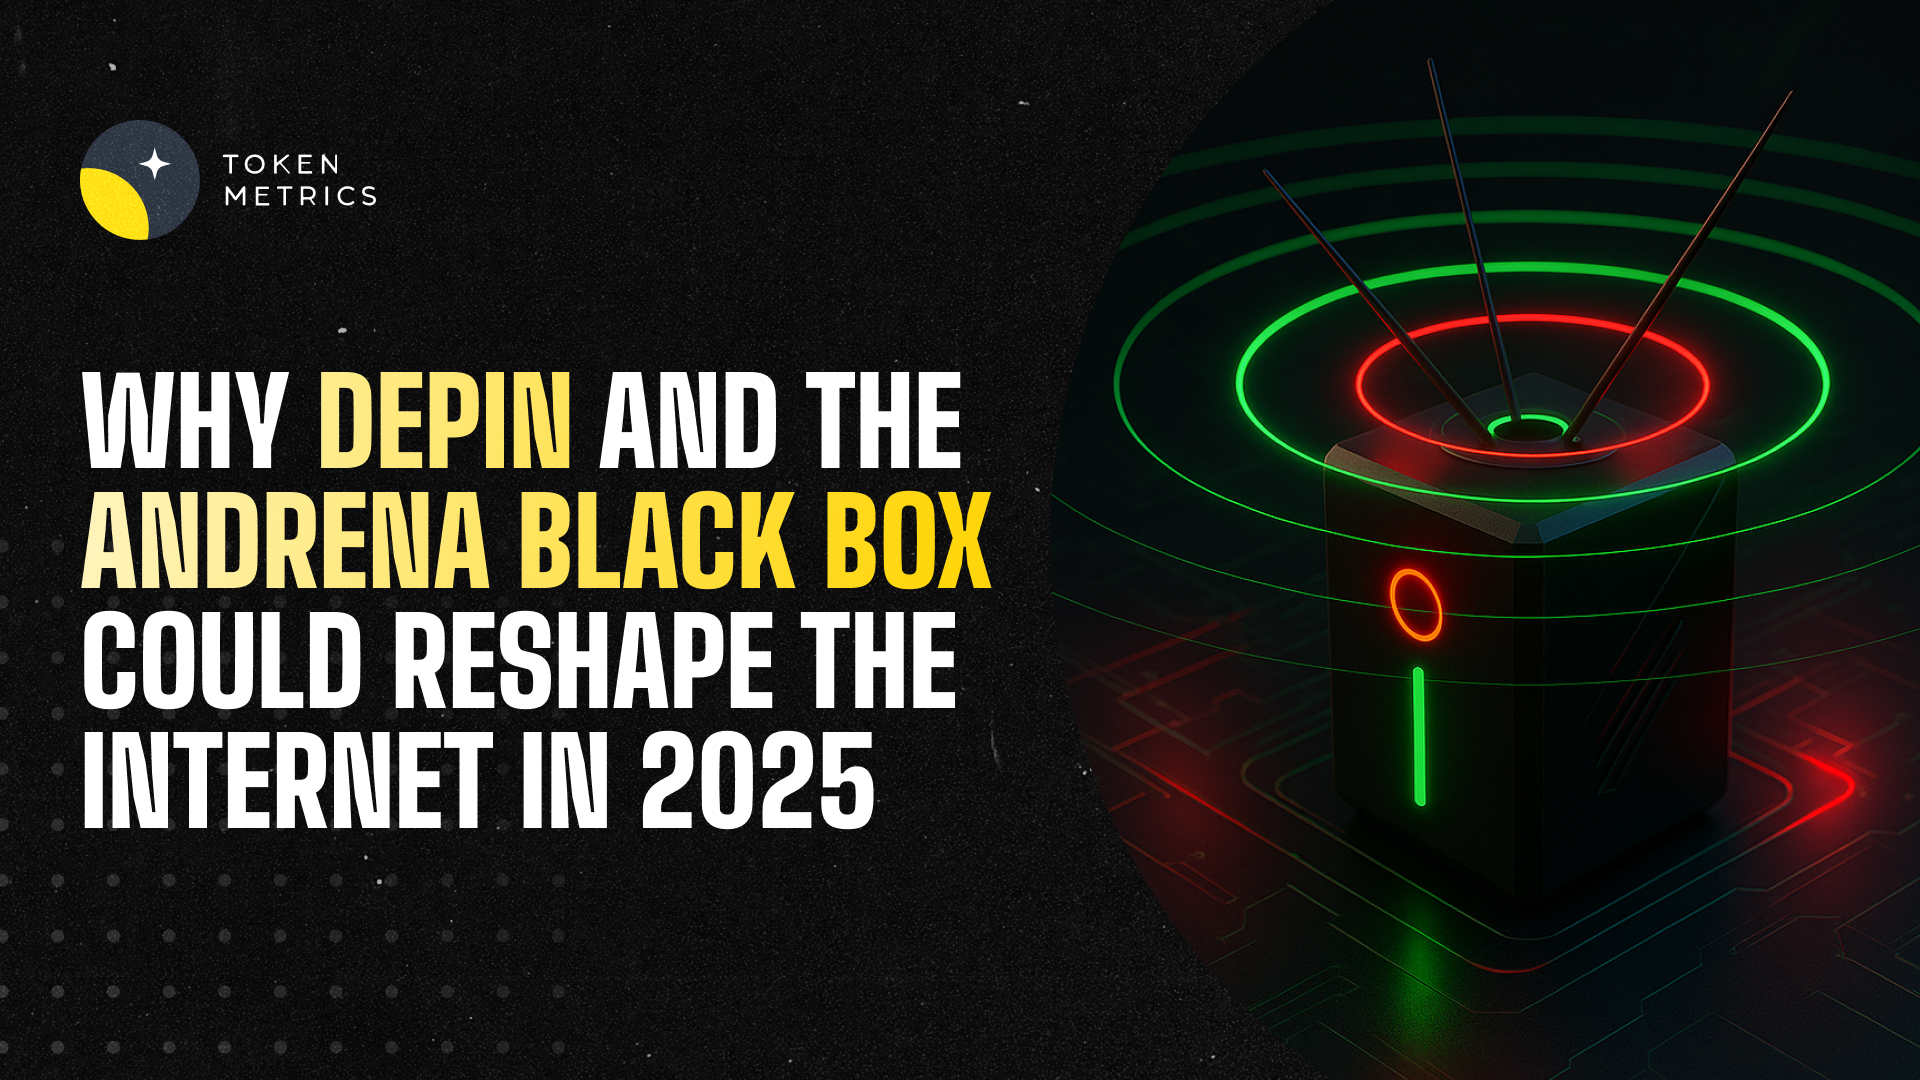
Decentralized Physical Infrastructure Networks (DePINs) are rapidly emerging as one of the most transformative sectors in the blockchain space. In 2025, projects like Andrena are pushing the boundaries of what’s possible by bridging real-world hardware with decentralized protocols. This blog takes a closer look at the DePIN thesis, Andrena’s approach, and why this project is on the radar of top investors and analysts.
DePIN stands for Decentralized Physical Infrastructure Networks. It refers to blockchain-powered networks that coordinate real-world infrastructure using token-based incentives. Use cases include:
In short, DePINs decentralize infrastructure deployment and management using blockchain-based coordination tools.
Andrena is a DePIN project building a decentralized internet backbone through a combination of physical devices and blockchain protocols. The project is developing a hardware device called Black Box, expected to launch in July.
Key features:
Andrena aims to give individuals and communities the power to run their own internet access points and be compensated in a decentralized system.
Token Metrics researchers flagged Andrena as a top pick for long-term infrastructure exposure. Here's why:
The project is currently in soft-launch mode with localized pilots and is pursuing exchange listings later this year. While details remain limited, the focus is on building a global decentralized ISP layer—a radical shift from the existing internet access model.
Previous attempts at decentralized internet often failed due to:
Andrena appears to be addressing these pain points with:
As with all early-stage infrastructure projects, there are risks:
Investors and builders should stay informed as more information becomes public.
The Token Metrics platform is actively monitoring the DePIN space through metrics such as:
Projects like Andrena and its ecosystem partners are closely watched for early indicators of momentum.
DePIN is one of the most compelling frontiers in crypto. It offers real-world, real-time applications that go far beyond speculation. Andrena is at the center of this movement, blending telecom hardware, Web3 incentives, and global deployment.
While it's still early, the signs are promising. From reputable backers to ambitious global plans, Andrena is a project worth watching in 2025 and beyond.

Introduction:
Even in a sluggish crypto market, meme coins continue to outperform many other asset classes. In 2025, these highly speculative assets are not only surviving—some are thriving. This blog examines the current state of the meme coin market, what’s driving the activity, and how on-chain data and crypto analytics can help decode the chaos.
Despite a broadly bearish macro environment, meme coins remain among the few bright spots in the crypto market. In the latest Token Metrics research webinar, several meme tokens showed outsized returns, including:
These tokens operate at low market caps and often launch with little or no formal whitepaper or utility. However, the power of narrative, social engagement, and rapid speculation continues to drive short-term gains.
1. Low Liquidity, High Volatility:
Small-cap meme tokens can easily generate parabolic moves with modest capital inflows.
2. Community-Led Narratives:
Tokens like Useless Coin and Startup thrive on viral momentum from crypto-native communities, particularly on X (Twitter) and Telegram.
3. Whale Activity as a Signal:
Token Metrics analysts observed that whales have been accumulating select meme coins. This isn’t an endorsement—but it’s a data point. Monitoring on-chain whale behavior offers clues about where smart money is moving.
Gobagana was cited as a high-risk Solana fork with minimal public information, yet it rapidly gained traction. On-chain analysis revealed:
The takeaway? Even opaque meme coins can trigger major rallies—particularly if accumulation patterns align with social volume.
The meme coin market is not without risk. The Token Metrics team emphasized several cautions:
As such, these assets are often best approached with a high-risk tolerance and clear entry/exit rules.
Using crypto analytics platforms like Token Metrics can help make sense of meme coin volatility. Tools that help include:
In 2025, data is more important than hype. While memes may dominate the narrative, only data reveals when the momentum shifts.
Interestingly, while meme coins have been surging, many infrastructure or protocol tokens remain flat. This divergence suggests that retail attention is still focused on short-term speculation.
That said, once Bitcoin breaks key resistance levels, we could see capital rotate into AI, DeFi, and infrastructure themes. Meme coins may be the “canary in the coal mine” indicating renewed retail appetite.
Meme coins remain the wild west of crypto—but they aren’t going away. In fact, they’re becoming more sophisticated, with deeper liquidity pools, faster launches, and increased integration with social media bots and automated token creators.
As always, meme coin trading demands discipline, skepticism, and a robust toolkit. Watch the whales, follow the data, and never trade what you don’t understand.

In the fast-paced world of cryptocurrency, discovering hidden gems—often called moonshots—can lead to life-changing returns. But the real challenge lies in separating hype from actual potential. In this guide, we’ll break down what crypto moonshots are, how they work, and how you can use Token Metrics to reliably find tokens with 100x upside.
The term moonshot comes from the idea of a crypto token “going to the moon,” or rapidly increasing in price. These are usually low-cap tokens with a compelling narrative, innovative technology, or early-stage market presence that give them high upside potential.
Moonshots rely on the combination of innovation, market timing, and community adoption. They often start unnoticed, then experience exponential growth once crypto traders and influencers catch on.
To avoid the trap of hype-driven tokens, it's essential to use data and analytics, not emotions. That’s where Token Metrics becomes your secret weapon.
Token Metrics is an AI-powered crypto analytics platform that helps you discover high-potential tokens with real-time data, grades, and backtested indicators. Here’s a step-by-step guide to using Token Metrics to uncover 100x opportunities:
Start from the main dashboard of the Token Metrics app.
Pro Tip: Look for tokens with rising Trader Grades and strong historical performance.
Once you’re in the Ratings section:
These are automatically generated by Token Metrics AI models using over 80+ data points, including:
Each Moonshot token is presented with a rich dataset to help you make informed decisions:
Bonus Feature: Toggle to “Past Moonshots” to review previous winners and assess the track record of the platform.
Click on any token in the Moonshots list to open its Token Details Page.
Here, you can:
This is where research and intuition meet. Use the available data to decide if this token fits your risk tolerance and investment thesis.
Token Metrics makes the process seamless:
This integration eliminates the hassle of going to third-party platforms to execute trades, saving time and reducing risk.
Token Metrics isn’t just about flashy picks—it’s about using data science and AI to gain an edge.
By combining early AI alerts with your own due diligence, you can position yourself ahead of the crowd.
Finding the next 100x crypto gem doesn’t have to be a guessing game. While the crypto space remains volatile, tools like Token Metrics help stack the odds in your favor. From real-time ratings to instant buy options and performance metrics, you have everything you need to make smart, data-driven bets on the future of crypto.
So if you're serious about turning small investments into big wins, start using Token Metrics to uncover moonshots before they go mainstream.
Try Token Metrics today and unlock the power of AI-driven crypto investing.

Introduction:
The DeFi landscape is evolving rapidly, and 2025 is shaping up to be a pivotal year. With innovations like permissionless lending, the ecosystem is transitioning into what many are calling DeFi 3.0. This blog explores what’s driving the shift, the platforms leading the charge, and what investors and developers need to know about this new wave.
Decentralized finance (DeFi) has experienced two major innovation cycles:
Now in DeFi 3.0, the focus has shifted to permissionless lending, advanced tokenomics, and integrated liquidity solutions.
1. Euler Finance
Euler has grown to over $1B in total value locked (TVL) and is rolling out a key innovation: EulerSwap. This module lets protocols provide liquidity for both swaps and borrowing in a single pool.
Key features:
2. Morpho
Morpho is another high-growth player. With support from Coinbase and over $4B in TVL, it's becoming a serious challenger to AAVE. Its permissionless lending architecture and novel liquidity provisioning model stand out.
3. Hyperliquid
While not a lender per se, Hyperliquid’s approach to perpetuals (perps) trading is noteworthy. It has captured 11% of Binance’s perp market share, signaling DeFi’s growing ability to challenge centralized platforms.
The benefits of removing centralized control over lending markets include:
However, challenges remain. The risk of undercollateralized positions and protocol exploits still exist. That’s why security—such as smart contract audits and on-chain firewalls—is critical.
During the webinar, the Token Metrics team highlighted how their platform tracks the performance of DeFi 3.0 projects using metrics like:
For example, Euler’s bullish signal flipped just before a 30% price rise, demonstrating the value of data-driven insight in volatile markets.
As the cycle evolves, we expect:
DeFi 3.0 is not just hype—it represents a fundamental shift in how decentralized finance operates. Permissionless lending, composable liquidity, and institutional-grade risk controls are turning DeFi into a more mature, scalable ecosystem.
As always, perform your own due diligence and keep an eye on platform fundamentals, smart contract risk, and ecosystem adoption.


 Create Your Free Account
9450 SW Gemini Dr
PMB 59348
Beaverton, Oregon 97008-7105 US
.svg)


.png)
Token Metrics Media LLC is a regular publication of information, analysis, and commentary focused especially on blockchain technology and business, cryptocurrency, blockchain-based tokens, market trends, and trading strategies.
Token Metrics Media LLC does not provide individually tailored investment advice and does not take a subscriber’s or anyone’s personal circumstances into consideration when discussing investments; nor is Token Metrics Advisers LLC registered as an investment adviser or broker-dealer in any jurisdiction.
Information contained herein is not an offer or solicitation to buy, hold, or sell any security. The Token Metrics team has advised and invested in many blockchain companies. A complete list of their advisory roles and current holdings can be viewed here: https://tokenmetrics.com/disclosures.html/
Token Metrics Media LLC relies on information from various sources believed to be reliable, including clients and third parties, but cannot guarantee the accuracy and completeness of that information. Additionally, Token Metrics Media LLC does not provide tax advice, and investors are encouraged to consult with their personal tax advisors.
All investing involves risk, including the possible loss of money you invest, and past performance does not guarantee future performance. Ratings and price predictions are provided for informational and illustrative purposes, and may not reflect actual future performance.


%20Price%20Prediction%20.webp)


%20Price%20Prediction.webp)


