


.png)
%201%20(1).png)


.png)


.png)


.png)
.png)


.png)


.png)


.png)


.png)
.png)


.png)


.png)

.png)
.png)
.png)
.png)
.png)
.png)
.png)
.png)
.png)


.png)


.png)

.png)
.png)


.png)


.png)
.png)
.png)
.png)

.png)
.png)


Research
Top Crypto Trading Platforms in 2025
When it comes to crypto trading platforms, Token Metrics is not an exchange, but a crypto analytics and crypto trading intelligence platform powered by AI.
Token Metrics Team
10 min


%201.svg)
%201.svg)
Big news: We’re cranking up the heat on AI-driven crypto analytics with the launch of the Token Metrics API and our official SDK (Software Development Kit). This isn’t just an upgrade – it's a quantum leap, giving traders, hedge funds, developers, and institutions direct access to cutting-edge market intelligence, trading signals, and predictive analytics.
Crypto markets move fast, and having real-time, AI-powered insights can be the difference between catching the next big trend or getting left behind. Until now, traders and quants have been wrestling with scattered data, delayed reporting, and a lack of truly predictive analytics. Not anymore.
The Token Metrics API delivers 32+ high-performance endpoints packed with powerful AI-driven insights right into your lap, including:
Getting started with the Token Metrics API is simple:
At Token Metrics, we believe data should be decentralized, predictive, and actionable.
The Token Metrics API & SDK bring next-gen AI-powered crypto intelligence to anyone looking to trade smarter, build better, and stay ahead of the curve. With our official SDK, developers can plug these insights into their own trading bots, dashboards, and research tools – no need to reinvent the wheel.
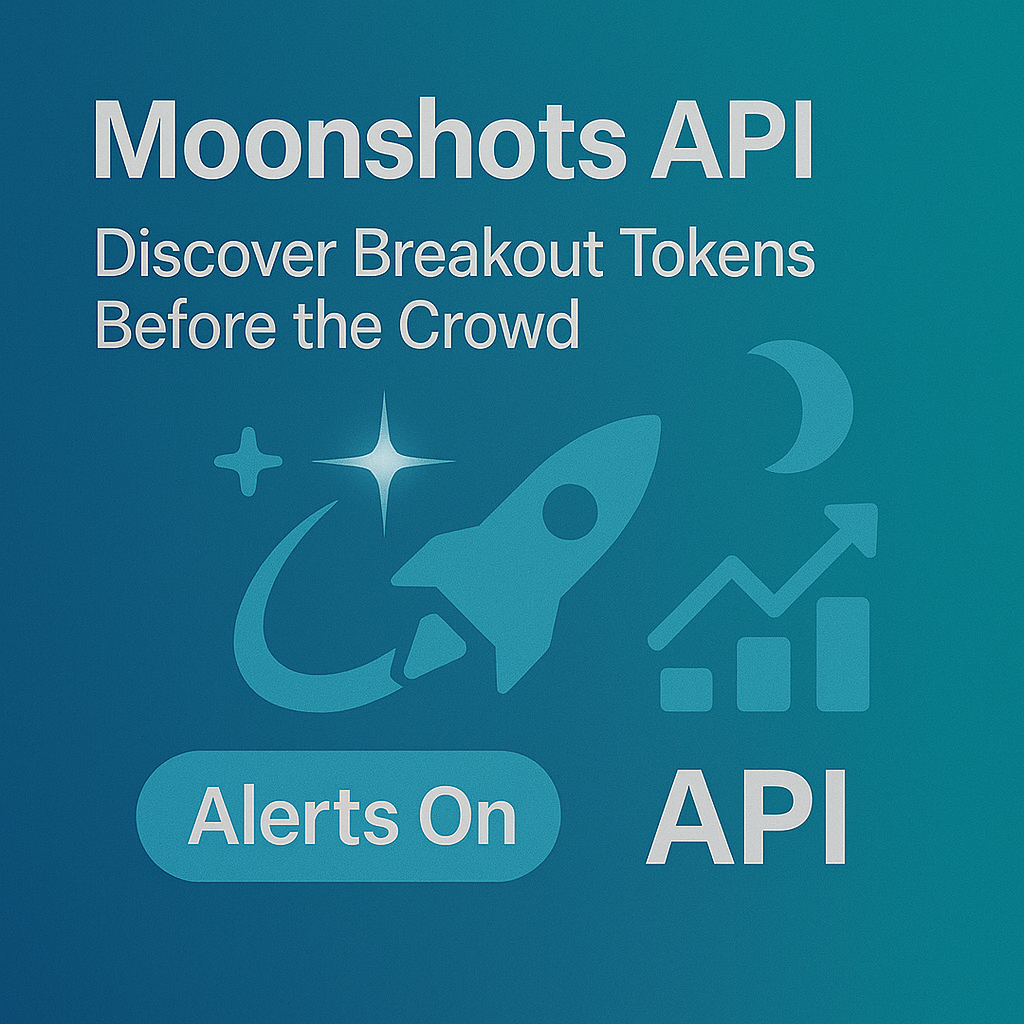
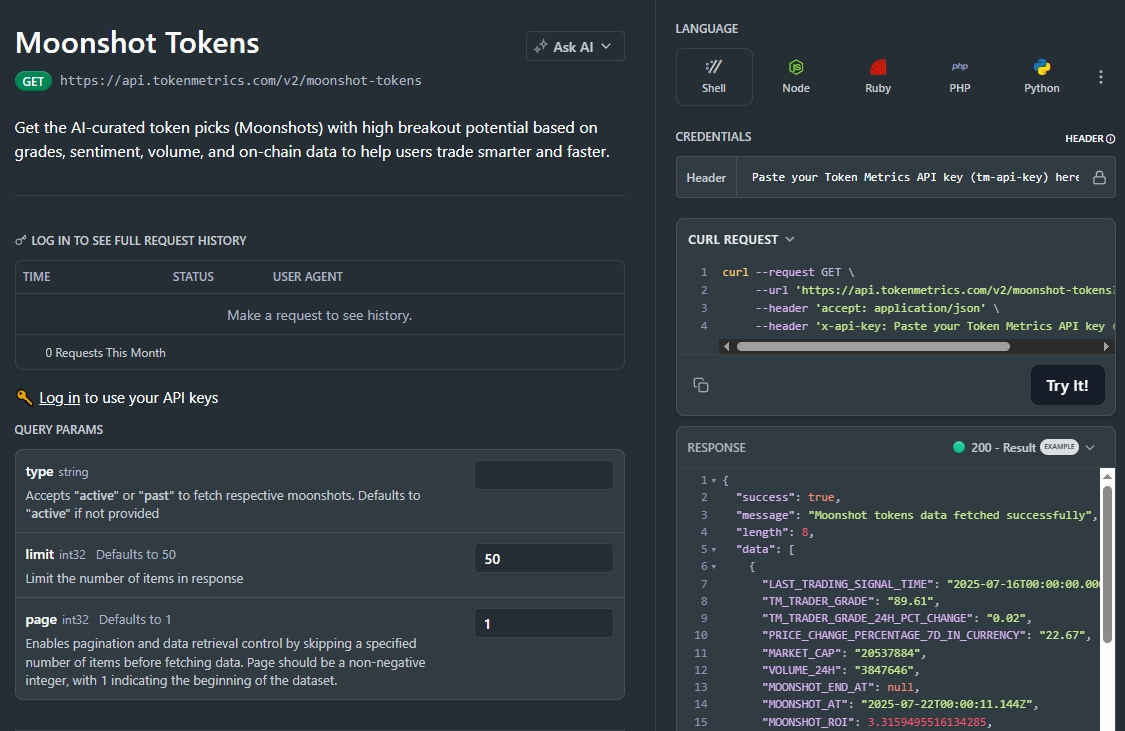
The biggest gains in crypto rarely come from the majors. They come from Moonshots—fast-moving tokens with breakout potential. The Moonshots API surfaces these candidates programmatically so you can rank, alert, and act inside your product. In this guide, you’ll call /v2/moonshots, display a high-signal list with TM Grade and Bullish tags, and wire it into bots, dashboards, or screeners in minutes. Start by grabbing your key at Get API Key, then Run Hello-TM and Clone a Template to ship fast.
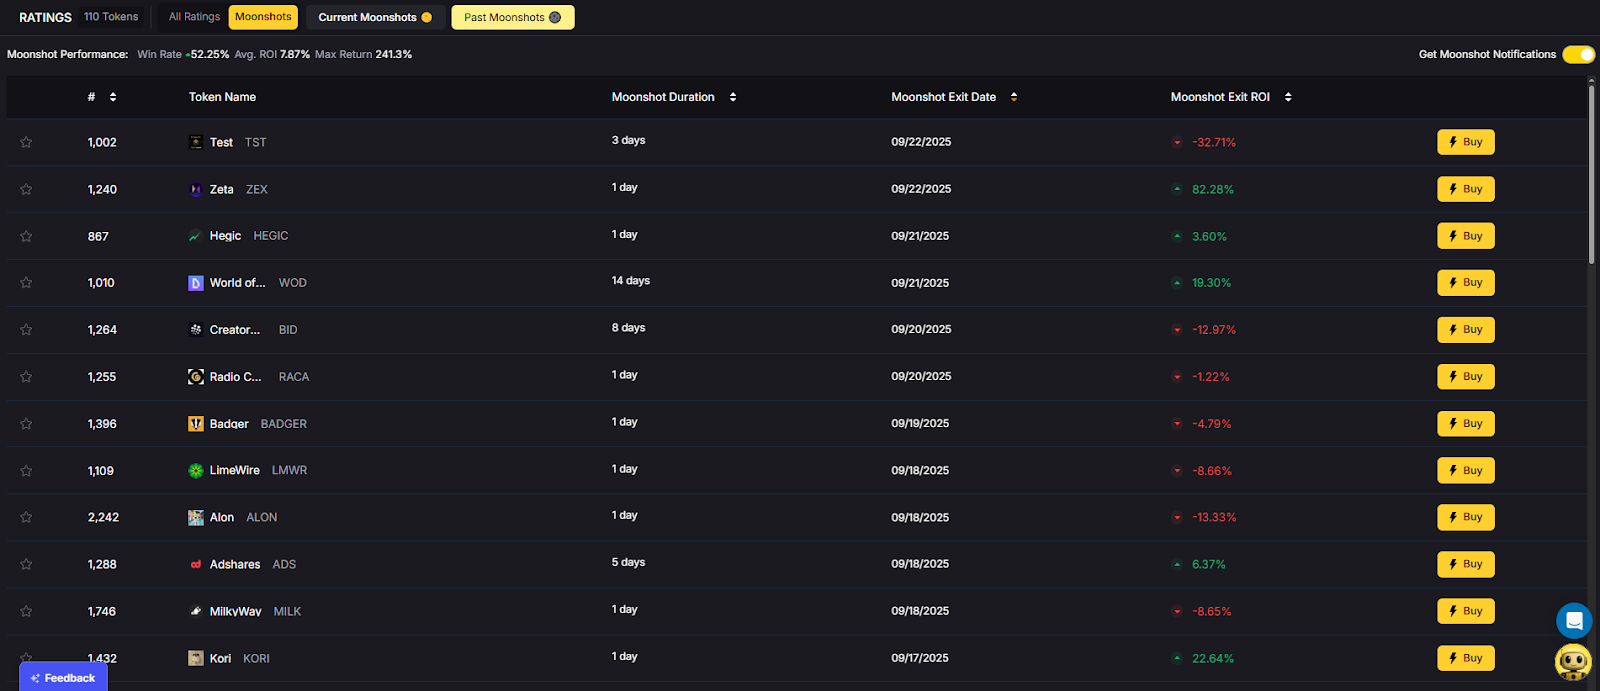
Discovery that converts. Users want more than price tickers—they want a curated, explainable list of high-potential tokens. The moonshots API encapsulates multiple signals into a short list designed for exploration, alerts, and watchlists you can monetize.
Built for builders. The endpoint returns a consistent schema with grade, signal, and context so you can immediately sort, badge, and trigger workflows. With predictable latency and clear filters, you can scale to dashboards, mobile apps, and headless bots without reinventing the discovery pipeline.
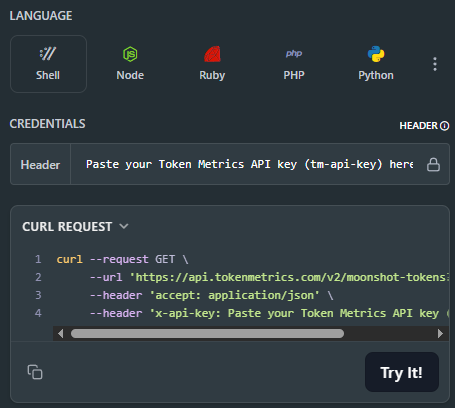
The Moonshots API cURL request is right there in the top right of the API Reference. Grab it and start tapping into the potential!
👉 Keep momentum: Get API Key • Run Hello-TM • Clone a Template
Fork a screener or alerting template, plug your key, and deploy. Validate your environment with Hello-TM. When you scale users or need higher limits, compare API plans.
The Moonshots endpoint aggregates a set of evidence—often combining TM Grade, signal state, and momentum/volume context—into a shortlist of breakout candidates. Each row includes a symbol, grade, signal, and timestamp, plus optional reason tags for transparency.
For UX, a common pattern is: headline list → token detail where you render TM Grade (quality), Trading Signals (timing), Support/Resistance (risk placement), Quantmetrics (risk-adjusted performance), and Price Prediction scenarios. This lets users understand why a token was flagged and how to act with risk controls.
Polling vs webhooks. Dashboards typically poll with short-TTL caching. Alerting flows use scheduled jobs or webhooks (where available) to smooth traffic and avoid duplicates. Always make notifications idempotent.
1) What does the Moonshots API return?
A list of breakout candidates with fields such as symbol, tm_grade, signal (often Bullish/Bearish), optional reason tags, and updated_at. Use it to drive discover tabs, alerts, and watchlists.
2) How fresh is the list? What about latency/SLOs?
The endpoint targets predictable latency and timely updates for dashboards and alerts. Use short-TTL caching and queued jobs/webhooks to avoid bursty polling.
3) How do I use Moonshots in a trading workflow?
Common stack: Moonshots for discovery, Trading Signals for timing, Support/Resistance for SL/TP, Quantmetrics for sizing, and Price Prediction for scenario context. Always backtest and paper-trade first.
4) I saw results like “+241%” and a “7.5% average return.” Are these guaranteed?
No. Any historical results are illustrative and not guarantees of future performance. Markets are risky; use risk management and testing.
5) Can I filter the Moonshots list?
Yes—pass parameters like min_grade, signal, and limit (as supported) to tailor to your audience and keep pages fast.
6) Do you provide SDKs or examples?
REST works with JavaScript and Python snippets above. Docs include quickstarts, Postman collections, and templates—start with Run Hello-TM.
7) Pricing, limits, and enterprise SLAs?
Begin free and scale up. See API plans for rate limits and enterprise options.
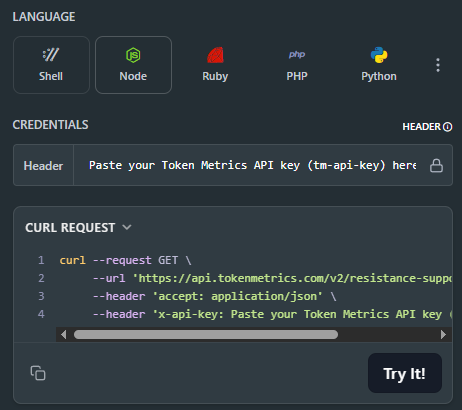
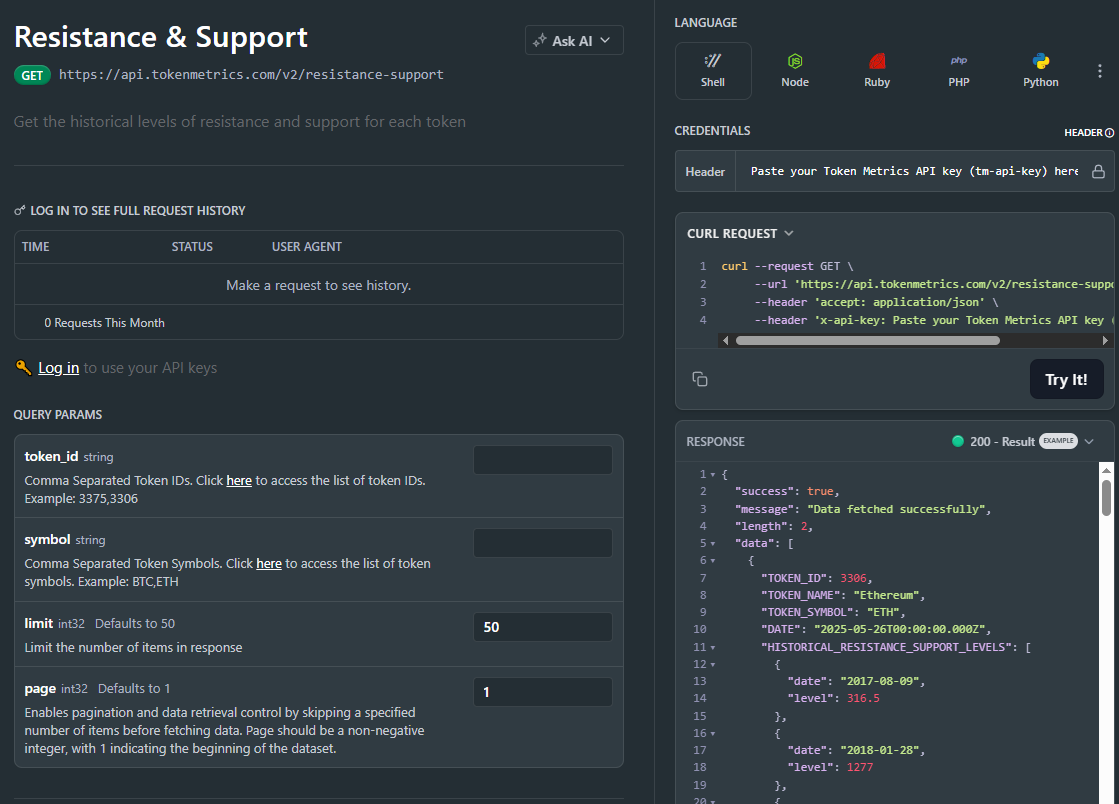
Most traders still draw lines by hand in TradingView. The support and resistance API from Token Metrics auto-calculates clean support and resistance levels from one request, so your dashboard, bot, or alerts can react instantly. In minutes, you’ll call /v2/resistance-support, render actionable levels for any token, and wire them into stops, targets, or notifications. Start by grabbing your key on Get API Key, then Run Hello-TM and Clone a Template to ship a production-ready feature fast.
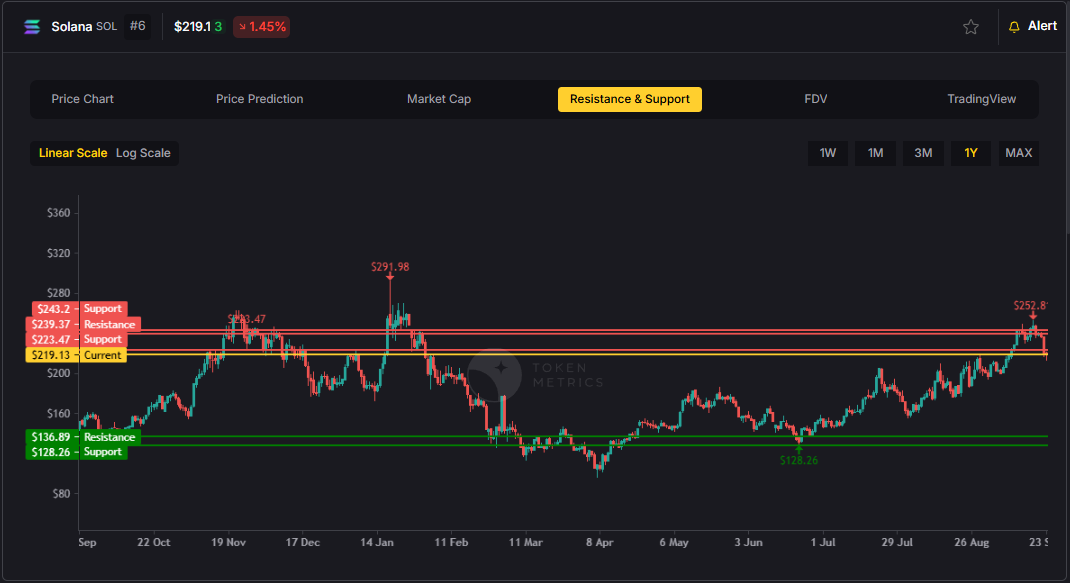
Precision beats guesswork. Hand-drawn lines are subjective and slow. The support and resistance API standardizes levels across assets and timeframes, enabling deterministic stops and take-profits your users (and bots) can trust.
Production-ready by design. A simple REST shape, predictable latency, and clear semantics let you add levels to token pages, automate SL/TP alerts, and build rule-based execution with minimal glue code.
Need the Support and Resistance data? The cURL request for it is in the top right of the API Reference for quick access.
👉 Keep momentum: Get API Key • Run Hello-TM • Clone a Template
Kick off with our quickstarts—fork a bot or dashboard template, plug your key, and deploy. Confirm your environment by Running Hello-TM. When you’re scaling or need webhooks/limits, review API plans.
The Support/Resistance endpoint analyzes recent price structure to produce discrete levels above and below current price, along with strength indicators you can use for priority and styling. Query /v2/resistance-support?symbol=<ASSET>&timeframe=<HORIZON> to receive arrays of level objects and timestamps.
Polling vs webhooks. For dashboards, short-TTL caching and batched fetches keep pages snappy. For bots and alerts, use queued jobs or webhooks (where applicable) to avoid noisy, bursty polling—especially around market opens and major events.
1) What does the Support & Resistance API return?
A JSON payload with arrays of support and resistance levels for a symbol (and optional timeframe), each with a price and strength indicator, plus an update timestamp.
2) How timely are the levels? What are the latency/SLOs?
The endpoint targets predictable latency suitable for dashboards and alerts. Use short-TTL caching for UIs, and queued jobs or webhooks for alerting to smooth traffic.
3) How do I trigger alerts or trades from levels?
Common patterns: alert when price is within X% of a level, touches a level, or breaks beyond with confirmation. Always make downstream actions idempotent and respect rate limits.
4) Can I combine levels with other endpoints?
Yes—pair with /v2/trading-signals for timing, /v2/tm-grade for quality context, and /v2/quantmetrics for risk sizing. This yields a complete decide-plan-execute loop.
5) Which timeframe should I use?
Intraday bots prefer shorter horizons; swing/position dashboards use daily or higher-timeframe levels. Offer a timeframe toggle and cache results per setting.
6) Do you provide SDKs or examples?
Use the REST snippets above (JS/Python). The docs include quickstarts, Postman collections, and templates—start with Run Hello-TM.
7) Pricing, limits, and enterprise SLAs?
Begin free and scale as you grow. See API plans for rate limits and enterprise SLA options.
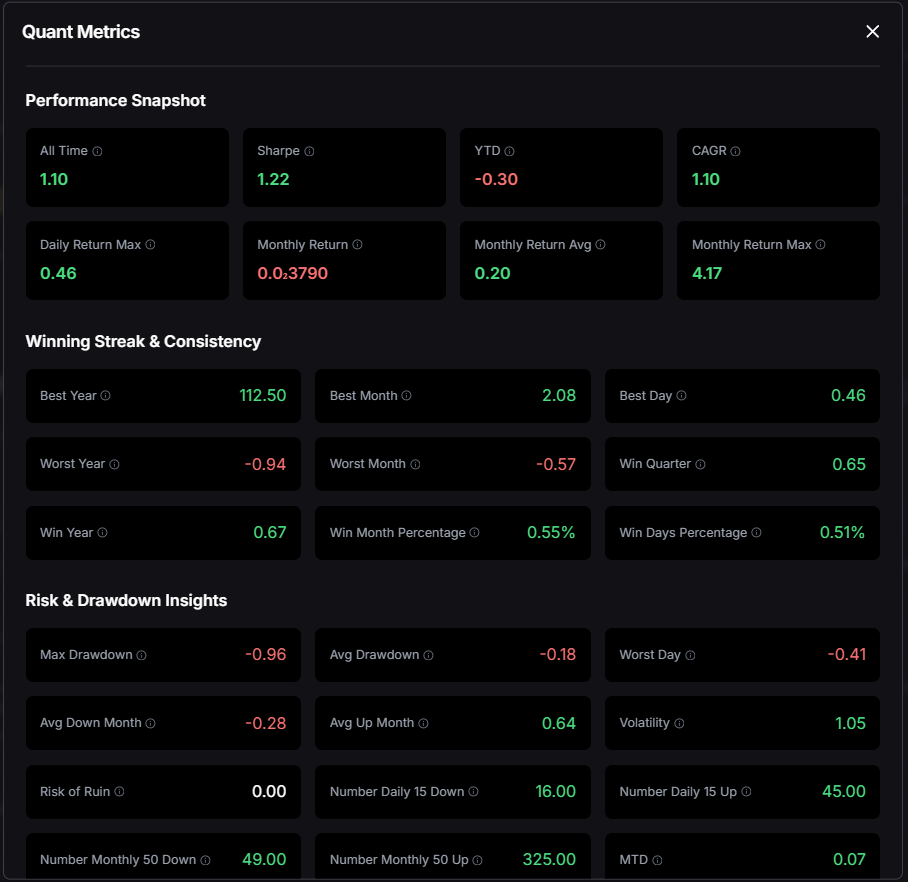
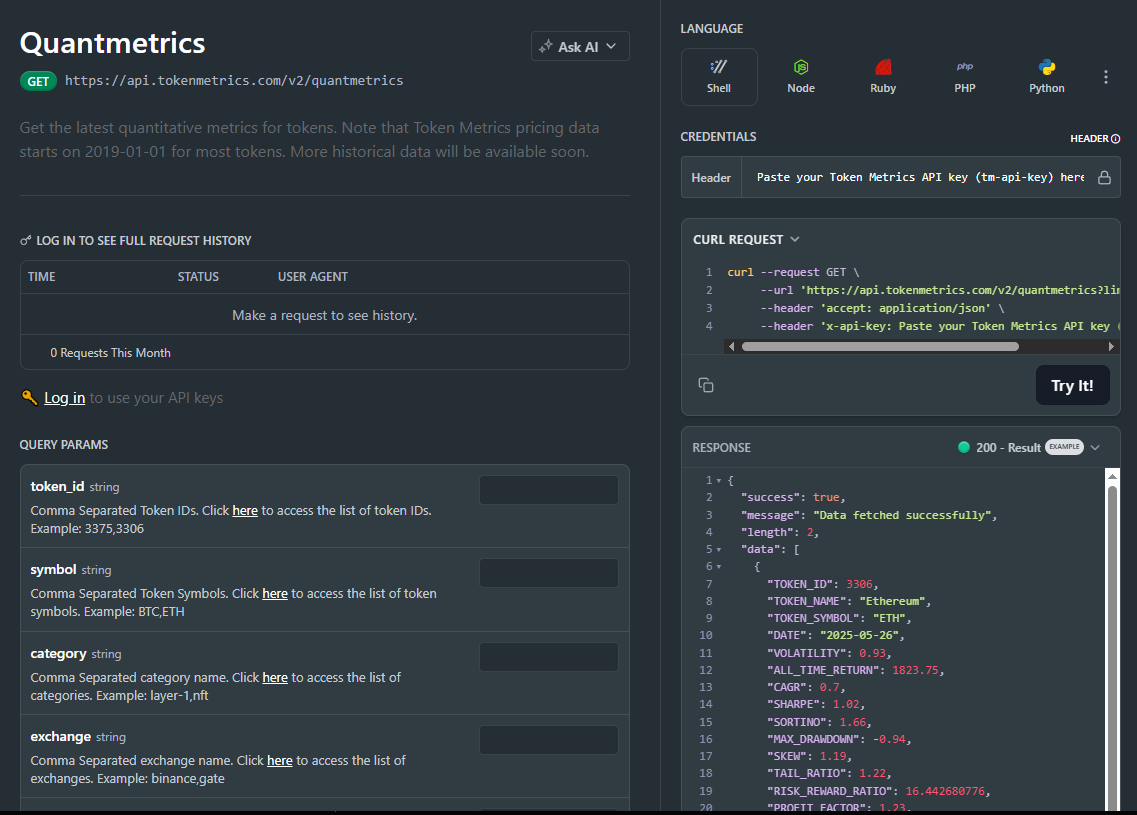
Most traders see price—quants see probabilities. The Quantmetrics API turns raw performance into risk-adjusted stats like Sharpe, Sortino, volatility, drawdown, and CAGR so you can compare tokens objectively and build smarter bots and dashboards. In minutes, you’ll query /v2/quantmetrics, render a clear performance snapshot, and ship a feature that customers trust. Start by grabbing your key at Get API Key, Run Hello-TM to verify your first call, then Clone a Template to go live fast.
Risk-adjusted truth beats hype. Price alone hides tail risk and whipsaws. Quantmetrics compresses edge, risk, and consistency into metrics that travel across assets and timeframes—so you can rank universes, size positions, and communicate performance like a pro.
Built for dev speed. A clean REST schema, predictable latency, and easy auth mean you can plug Sharpe/Sortino into bots, dashboards, and screeners without maintaining your own analytics pipeline. Pair with caching and batching to serve fast pages at scale.
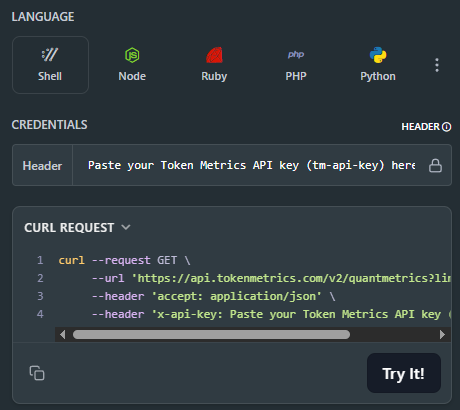
The Quant Metrics cURL request is located in the top right of the API Reference, allowing you to easily integrate it with your application.
👉 Keep momentum: Get API Key • Run Hello-TM • Clone a Template
Kick off from quickstarts in the docs—fork a dashboard or screener template, plug your key, and deploy in minutes. Validate your environment with Run Hello-TM; when you need more throughput or webhooks, compare API plans.
Quantmetrics computes risk-adjusted performance over a chosen lookback (e.g., 30d, 90d, 1y). You’ll receive a JSON snapshot with core statistics:
Call /v2/quantmetrics?symbol=<ASSET>&window=<LOOKBACK> to fetch the current snapshot. For dashboards spanning many tokens, batch symbols and apply short-TTL caching. If you generate alerts (e.g., “Sharpe crossed 1.5”), run a scheduled job and queue notifications to avoid bursty polling.
1) What does the Quantmetrics API return?
A JSON snapshot of risk-adjusted metrics (e.g., Sharpe, Sortino, volatility, max drawdown, CAGR) for a symbol and lookback window—ideal for ranking, sizing, and dashboards.
2) How fresh are the stats? What about latency/SLOs?
Responses are engineered for predictable latency. For heavy UI usage, add short-TTL caching and batch requests; for alerts, use scheduled jobs or webhooks where available.
3) Can I use Quantmetrics to size positions in a live bot?
Yes—many quants size inversely to volatility or require Sharpe ≥ X to trade. Always backtest and paper-trade before going live; past results are illustrative, not guarantees.
4) Which lookback window should I choose?
Short windows (30–90d) adapt faster but are noisier; longer windows (6–12m) are steadier but slower to react. Offer users a toggle and cache each window.
5) Do you provide SDKs or examples?
REST is straightforward (JS/Python above). Docs include quickstarts, Postman collections, and templates—start with Run Hello-TM.
6) Polling vs webhooks for quant alerts?
Dashboards usually use cached polling. For threshold alerts (e.g., Sharpe crosses 1.0), run scheduled jobs and queue notifications to keep usage smooth and idempotent.
7) Pricing, limits, and enterprise SLAs?
Begin free and scale up. See API plans for rate limits and enterprise SLA options.

Are you looking for a way to personalize your crypto investing experience like never before? Do you want to have access to a wealth of data and insights that can help you make smarter and faster investment decisions? If so, you’re going to love our latest innovation: the Customizable Ratings Page.
The Customizable Ratings Page is a powerful tool that allows you to tailor your Token Metrics dashboard according to your preferences and goals. You can choose from an expanded selection of columns and metrics, apply advanced filters, and save your preferred layout for future use. This way, you can have a streamlined and efficient interface that shows you exactly what you need to know about various cryptocurrencies.
In this blog post, we’ll show you how the Customizable Ratings Page works and why it’s a game-changer for crypto investors.
The Customizable Ratings Page is designed to give you more control and flexibility over your crypto investing journey. Here’s how it works:
You can also use advanced filters to narrow down your search for specific coins or criteria. For example:
You can apply these filters by clicking on the filter icon next to each column header and entering your desired values or ranges.
The Customizable Ratings Page is more than just a cosmetic upgrade. It’s a game-changer for crypto investors because it offers several benefits:
Here's a great video to give you a better understanding of the Customizable Ratings Page:
With an expanded selection of columns and metrics, advanced filters, and saved preferences, we’re putting users in the driver’s seat when it comes to analyzing and selecting the best investment opportunities.
At Token Metrics, we’re committed to providing the best tools and resources for our customers to succeed in the ever-evolving world of cryptocurrencies. The Customizable Ratings Page is just another step in our mission to help you make well-informed investment decisions, tailored to your unique goals and strategies.

Crypto has indeed gained significant attention and has been a popular investment option in recent times. However, analyzing a cryptocurrency before investing is crucial to make informed decisions and minimize risks. In this article, we will help you understand the key factors that impact a cryptocurrency's price and demand. By doing so, we aim to make it easier for you to embark on your crypto journey with confidence.
But why is it essential to analyze a cryptocurrency before investing in the first place? The answer lies in the volatile nature of cryptocurrencies. The value of a cryptocurrency can fluctuate significantly within a short time, making it a high-risk investment option. By analyzing a cryptocurrency's underlying factors, you can gain insights into its potential risks and rewards, which can help you make more informed investment decisions. With that in mind, let's dive into the key factors that affect a cryptocurrency's value.
There are two popular ways (or types) to analyze a cryptocurrency before investing in it.
Fundamental analysis is the starting point of understanding the history of any crypto asset you want to invest in.
It involves getting to the Adam and Eve of an asset, the team behind the project, the price history, the white paper, the tokenomics of the crypto asset - the whole deal.
The sole purpose of performing this analysis is to understand if the asset is overvalued or undervalued. Having said that, fundamental analysis needs the support of technical analysis to predict the crypto asset completely.
The most important factors to consider when performing the fundamental analysis are:
Every crypto asset is backed by a white paper demonstrating the objectives and other technical details. While some details might seem quite difficult to understand for casual investors, it’s crucial to learn about the vision and mission of the project.
The white paper should clearly explain the goals of the project, how they plan to achieve these goals using their technology, and how the cryptocurrency will function in the market.
One red flag is a white paper full of generic promises with no proper detailing.
To estimate the project's future performance, try to get the details of the professional experience that the team holds.
For this, you can scroll through the LinkedIn profiles of the technical or leadership staff. You can also check the crypto asset's "About Us" page to get the details of who is heading the project.
If you don't find the identity of the founders and the team anywhere on the website or the internet, consider it a red flag in most cases.
Find the executive team that handles the financials, operations, and vision. Learning about who is leading the project can help you understand the success probability of the crypto asset.
So, here are a few questions to consider when researching a crypto company’s leadership:
Crypto is a community-driven space. Knowing whether the project is pure hype and speculation or is genuinely trusted by a community can help you decide the success of a crypto asset.
Join the community's Discord or Telegram channel to understand it better. No discussion means no growth.
Crypto assets should have a clear vision and mission if they are genuinely intending to grow.
They should have a direction and a road map and be well-organized in everything they do.
Similar to traditional companies, cryptocurrencies should have a well-defined roadmap with specific goals and timelines. It is crucial to assess the roadmap before investing in a cryptocurrency to ensure that the asset has a clear path to success. Understanding how the cryptocurrency plans to achieve its goals is essential in making informed investment decisions.
If the goals outlined in the roadmap are too generic and lack specificity, it can be a red flag. Additionally, if the timelines are not well mapped out or appear unrealistic, it could indicate poor planning or execution, which can impact the cryptocurrency's long-term success.
Tokenomics refers to the economic principles that govern the supply, distribution, and circulation of a cryptocurrency. These principles significantly impact the price and long-term viability of a crypto asset. Understanding the supply and demand dynamics is crucial for investors looking to make informed decisions.
Similar to the stock market, the crypto market's price is influenced by the intersection of demand and supply. When demand exceeds supply, the price of a cryptocurrency tends to increase, and vice versa. Therefore, it is essential to consider the following three data points when evaluating a cryptocurrency investment opportunity:
In summary, evaluating a cryptocurrency's supply dynamics is an essential aspect of making informed investment decisions. Understanding the circulating, total, and maximum supply of a cryptocurrency can provide valuable insights into its potential value and long-term viability.
Cryptocurrencies are known for their high volatility, but there are various factors that impact their price. Understanding these factors, such as token supply and marketing efforts, is crucial in determining the dependability of a cryptocurrency's price. Additionally, reviewing a cryptocurrency's price history can provide valuable insights into its growth or decline over time.
Analyzing price fluctuations in a given time period can help you determine whether a cryptocurrency is thriving or dying. For instance, if a cryptocurrency experienced a significant price spike but failed to recover over subsequent months or years, it could be a warning sign for investors. Similarly, market capitalization and trading volume are crucial indicators of a cryptocurrency's potential. If a cryptocurrency's market cap continues to decline over time, or if there is little trading volume, it may not be a viable investment option.
Technical analysis of a crypto asset involves analyzing historical price and volume data to identify patterns and trends that can provide insight into future price movements.
Here are 5 factors to consider in the technical analysis of a crypto asset:
Technical analysis can provide valuable insights into a cryptocurrency's price movements, but it requires expertise in the field. The term "technical" refers to the complex algorithms and charts used to analyze market trends and predict future price movements.
Therefore, it may be too complicated for casual investors who do not have a strong understanding of the underlying principles. Here at Token Metrics, we automated Technical Analysis for thousands of cryptocurrencies with the help of AI and Machine Learning.
Just visit the page of a crypto you want to analyze, click on "Trader" from the left menu, and then click on the "Resistance and Support Levels" tab to start analyzing.
A cryptocurrency analysis involves examining and verifying a lot of information about a digital asset.
To get the deepest understanding of an asset, you can start with a fundamental analysis followed by a technical analysis.
We, at Token Metrics, work hard to make all of these tools available to you with a click of a button, automated and powered by AI to help you analyze thousands of cryptocurrencies fast.

In the world of crypto trading, technical analysis is a popular method for predicting the future price movements. One of the most well-known term in technical indicators is the "golden cross," which occurs when the short-term moving average of a cryptocurrency's price crosses above its long term moving average. While this pattern is not a guaranteed predictor of future price increases, many traders use it as a part of their overall trading strategy.
In this blog post, we will explore the concept of the golden cross in more detail, including what it is, how it works, and some of the potential risks and strategies of using this pattern in cryptocurrency trading.
Golden Crossing is a technical analysis term used in financial markets to describe a bullish trend signal that occurs when a shorter-term moving average crosses above a longer-term moving average. The term "golden" represents this crossover's positive sentiment among traders and investors.
A Golden Cross occurs when a shorter-term moving average (such as the 50-day moving average) crosses above a longer-term moving average (such as the 200-day moving average).
This crossing is thought to indicate that the stock's price has been trending higher in the short term and is likely to continue in the longer term. This is considered a bullish signal in technical analysis.
To identify a Golden Cross on a chart, you will need to plot two moving averages with different periods. The most common combination used to identify a Golden Cross is the 50-day moving average and the 200-day moving average.
Here are the steps to identify a Golden Cross on a chart:

Once you have identified the Golden Cross, you can use it as a signal to buy the crypto asset.
However, as we mentioned earlier, it is important to consider other factors before making an investment decision and not solely rely on a single technical analysis tool.
The Golden Cross strategy is a technical analysis tool traders and investors use to identify potential buy signals in financial markets. Here are some steps to use the Golden Cross strategy:
Note: It is important to note that the Golden Cross strategy does not guarantee success, and traders and investors should always be aware of the risks involved in trading and investing. As with any trading strategy, conducting proper research, managing risk, and having a well-defined trading plan are essential.
Here are seven Golden Cross trading strategies that traders and investors can use to identify potential buy signals in financial markets:
Here are some examples of Golden Cross signals that have occurred in financial markets:
Observing past performance does not indicate future results, so conduct your research, understand the risks involved, and dive deep into investing. The Golden Cross signal is just one tool among many that traders and investors use to identify potential buy signals in financial markets.
Like any trading strategy, the Golden Cross strategy also comes with risks that traders and investors should be aware of:
This is why traders and investors should carefully consider the risks associated with the Golden Cross strategy and their own risk tolerance and investment objectives before using this strategy in financial markets.
All indicators, in general, are considered to show some ‘lag’, and that no indicator can actually predict the future. It is also observed that the golden cross often produces a false signal leading to regular failure in its predicting power.
Therefore, a golden cross should always be followed by confirmation from other signals and indicators before fixating on a trade. This is why we use more than 50 data points in our AI-based models to predict the cryptocurrency market correctly, here at Token Metrics.
The key to using golden cross - including additional filters and indicators - is to always use proper risk parameters and ratios. Remember that your risk-to-reward ratio has got to be in your favour to yield better results than just following the cross blindly.

If you are wondering what is spot trading, this is the place to be.
Spot trading is a fundamental mechanism that allows investors to buy or sell financial assets for immediate delivery or settlement. This type of trading is prevalent in financial markets, such as stocks, currencies, commodities, and cryptocurrencies, and plays a vital role in facilitating price discovery and market efficiency.
One of the significant benefits of spot trading is its flexibility, which enables investors to respond quickly to market movements and capitalize on short-term opportunities.
In simple words, Spot trading in crypto refers to buying and selling cryptocurrencies for immediate delivery or settlement. In other words, when you engage in spot trading, you exchange one cryptocurrency for another at the current market price without delay or future delivery.
When you engage in spot trading, you're typically looking to profit from short-term price fluctuations in the market. For example, you might buy a cryptocurrency when you think its price will increase and then sell it shortly after to realize a profit. Alternatively, you might sell a cryptocurrency when you consider its price will decrease and repurchase it later at a lower price.
Spot trading differs from other forms of crypto trading, such as futures trading or options trading, which involve buying or selling contracts that obligate you to buy or sell a certain amount of cryptocurrency at a future date and price. In contrast, spot trading involves only the immediate exchange of cryptocurrencies at their current market value.
Crypto spot trading allows users to buy or sell cryptocurrencies at the current market price in real-time. Here are the basic steps involved in a typical crypto spot trade:
It's important to note that the price of cryptocurrencies can be volatile and may change rapidly. Hence, exercising caution and conducting your own research is important before engaging in spot trading.
There are several pros and cons to consider when it comes to crypto spot trading:
Overall, spot trading can be a good way to trade cryptocurrencies for those comfortable with the risks involved and want a simple and cost-effective way to take advantage of short-term price movements. However, it's important to do your research and understand the risks involved before engaging in any trading.
Here are some of the key differences between these trading methods:
Spot trading
Futures trading
Margin trading
Spot trading is better suited for those who want to buy or sell cryptocurrencies at the current market price. In contrast, futures trading is better suited for those who want to speculate on future price movements or hedge against potential losses. At the same time, margin trading is better suited for those who wish to increase their trading position and potential profits through leverage. Understanding the differences between the three is important as choosing the best fits your trading goals and risk tolerance.
Spot trading can be profitable but involves risk, and profits are not guaranteed. The profitability of spot trading depends on various factors, such as market conditions, the timing of trades, and the individual trader's knowledge and experience.
To increase the chances of profitability, traders may employ various strategies, such as technical analysis, fundamental analysis, or trading on news events. Traders may also use risk management techniques, such as setting stop-loss orders, to limit potential losses.
In conclusion, spot trading is an essential aspect of financial markets that allows investors to buy or sell assets for immediate delivery or settlement. It offers several advantages, including liquidity, transparency, and flexibility, making it a popular choice among traders worldwide.
However, spot trading also involves risks such as price volatility and counterparty risk, which investors must manage effectively. Overall, spot trading plays a critical role in facilitating price discovery and market efficiency, enabling investors to make informed investment decisions and capitalize on market opportunities.
The information provided on this website does not constitute investment advice, financial advice, trading advice, or any other sort of advice and you should not treat any of the website's content as such.
Token Metrics does not recommend that any cryptocurrency should be bought, sold, or held by you. Do conduct your own due diligence and consult your financial advisor before making any investment decisions.

Cryptocurrency price APIs are essential tools for anyone looking to monitor and analyze the performance of various digital assets. These APIs provide real-time price updates and historical data, allowing users to make informed decisions about buying, selling, and trading cryptocurrencies.
There are many cryptocurrency price APIs available in the market, each with its own set of features and benefits. In this blog post, we will explore some of the key features of crypto price APIs, how to use them and why they are important for investors and traders.
Crypto Price API is a way to get real-time and historical cryptocurrency price data.
This allows developers, traders, and investors to access accurate and up-to-date information on the value of various cryptocurrencies, including Bitcoin, Ethereum, and Litecoin, among others.
The API is designed to be fast, reliable, and easy to use, with a variety of endpoints and parameters to customize the data returned.
It offers a range of features, including support for multiple exchanges and currencies, customizable time intervals, and access to a range of trading data, including volume and order book information.
Overall, the Crypto Price API is a valuable tool for anyone interested in tracking cryptocurrency prices or developing applications that involve cryptocurrencies.
There are several types of crypto price APIs available that provide real-time price data for cryptocurrencies.
The most common type is the RESTful API, which allows developers to retrieve price data using HTTP requests.
WebSocket API is another popular type of crypto price API that provides real-time streaming of data.
The choice of API will depend on the developer's specific needs and the level of detail required for their application.
Using the Token Metrics Data API, one can get real-time prices for cryptocurrencies using the Price endpoint.
What’s inside the $TMAI API?
✅ AI-Powered Trading Signals – Bullish and bearish calls backed by over 80 data points
✅ Real-Time Grades – Instantly assess token momentum with Trader & Investor Grades
✅ Curated Indices – Plug into ready-to-use crypto portfolios by sector or market cap
✅ Lightning-Fast Performance – Built for bots, dashboards, dApps, and next-gen trading tools
Whether you’re building a DeFi dashboard, an alpha-sniping bot, or your own crypto terminal — this is your edge.
Getting started is as easy as:
1. Obtaining an API key by signing up for the Token Metrics Data API Plan.
2. Next, you will need to integrate the API into your application or website using the programming language of your choice. This typically involves sending HTTP requests to the API endpoint and parsing the JSON data that is returned.
3. Use the Price endpoint to make a call to the API and get real-time prices of cryptocurrencies.
Learn more about all the available endpoints here.
For crypto price APIs to be considered good, the following features are required to exist:
Real-Time Price Updates
One of the most critical features of a cryptocurrency price API is real-time price updates. With the volatile nature of the crypto market, it is crucial to have up-to-date information on the latest price changes. A good API should provide real-time data feeds that allow users to track changes in the market as they happen.
Historical Data
Another essential feature of a cryptocurrency price API is historical data. Historical data is crucial for analyzing the performance of a particular asset over time. With this information, traders can identify patterns and trends in the market and make informed decisions about when to buy or sell a particular asset.
Data Aggregation
Crypto price APIs often aggregate data from multiple exchanges, providing users with a comprehensive view of the market. This feature is especially useful for traders who want to compare prices across different exchanges and find the best deals.
Customizable Notifications
A good cryptocurrency price API should offer customizable notifications, alerting users when certain price thresholds are met. This feature is particularly useful for investors who want to receive alerts when a particular asset reaches a certain price level.
Accuracy
It is important for the API to return accurate data that is actionable and free-from error. If that is not the case, traders can lose a lot of money relying on false data.
Here is the list of top crypto API providers with Free and paid plans.
In conclusion, crypto APIs play a vital role in the world of cryptocurrency by enabling developers to create innovative applications that interact with various blockchain networks. The best crypto APIs provide reliable and secure access to blockchain data, allowing developers to build applications with confidence and efficiency.
When choosing a crypto API, it is important to consider factors such as pricing, ease of use, security, and the range of features available.
As the ecosystem and toolset surrounding this asset class continue to expand, there has never been a more opportune moment to get started.

CoinGecko is a cryptocurrency data aggregator and analysis platform that provides comprehensive information on various aspects of the cryptocurrency market. It has gained huge popularity and is now one of the most commonly used platforms in the crypto sector.
CoinGecko also offers a an API, which provides access to cryptocurrency market data.
CoinGecko API is a freemium, public API that provides developers with access to data about cryptocurrencies and their market prices, trading volumes, market capitalization, and other related information.
This data can be used for a variety of applications, including cryptocurrency portfolio tracking, trading bots, price alert systems, and more.
The API provides a number of endpoints that developers can use to retrieve different types of data, including cryptocurrency prices, market capitalization, NFT floor prices, exchange trading volumes, trading pairs, contract address data, crypto categories, crypto derivatives, images, developer activity, and other crypto industry related data.
CoinGecko provides developers an easy-to-use API that can be integrated into their applications to retrieve information about cryptocurrencies.
Through its API, CoinGecko offers various endpoints that allow developers to query cryptocurrency data in different ways. Some of the endpoints include:
Price Endpoint: This endpoint provides real-time and historical price data for cryptocurrencies.
Exchange Rates Endpoint: This endpoint provides exchange rates for various fiat currencies and cryptocurrencies.
Market Data Endpoint: This endpoint provides various market data such as market capitalization, trading volume, and supply for cryptocurrencies.
Developer Endpoint: This endpoint provides data related to the development activities of cryptocurrencies, such as the number of commits, stars, forks, and subscribers on their Github repositories.
Social Media Endpoint: This endpoint provides data on the social media activities of cryptocurrencies, such as the number of followers, tweets, and Reddit subscribers.
To use the CoinGecko API, developers need to obtain an API key from the CoinGecko website. They can then send HTTP requests to the API endpoints to retrieve the desired data. The API returns the data in JSON format, which can be easily parsed and used in the developer's application or a website.
No, you need to make individual requests to the API to retrieve data.
CoinGecko API basic version is free* for those who want it for personal use and testing purposes only with some conditions and limits. CoinGecko free API has a rate limit of 10-30 calls/minute.
The free plan has limited endpoints and the number of calls you can make.
You need to upgrade to make the most out of the CoinGecko API.
CoinGecko is not the only place to get your Crypto data. In fact, there are some very great alternatives you can use to get propriety data like price prediction, indicators, and more, not just real-time prices.
Let's look at some of the best CoinGecko alternatives you can use today.
Token Metrics is an AI driven crypto analysis platform which enables its users to research thousands of cryptocurrencies in an automated way. Token Metrics recently launched a Crypto Data API for crypto investors and developers.
This AI-powered API allows users to get access to more than 10 actionable data endpoints to power trading bots, models, and platforms, to make the most money in the crypto space.
The CoinMarketCap API offers both free and paid tiers, with different limits and access to endpoints.
Like CoinGecko, CoinMarketCap also provides access to data like real-time prices, volume, market capitalization, social media information, and more.
CryptoCompare API is another option for accessing real-time and historical cryptocurrency market data. It allows developers to easily integrate data such as prices, trading volume, and exchange rates into their applications.
The API supports a wide range of cryptocurrencies, exchanges, and trading pairs, making it a great resource for anyone looking to build a cryptocurrency-related project.
CoinGecko is one of the leaders in the crypto space, providing access to insightful data about thousands of cryptocurrencies and the market.
However, as time goes on, better solutions are being built that are more powerful and use AI to power their data, like Token Metrics. This allows investors to turn data into actionable insights to make informed investment decisions.

Cryptocurrencies have been on the rise, with Bitcoin leading the charge. But what is Cosmos (ATOM) Crypto, a lesser-known digital currency? And is it a good investment?
Cosmos is one of the most recent cryptocurrencies to enter the market, drawing the attention of traders and investors alike. This article will examine Cosmos crypto and ATOM coin, how it works, and if it is a good investment.
We'll also examine the risks and rewards of investing in this digital currency. By the end of this article, you'll be well-equipped to decide whether investing in Cosmos crypto is right for you.
Cosmos crypto is a decentralized blockchain network that aims to enable interoperability between different blockchains. It is an ecosystem of connected blockchains, allowing for the secure transfer of assets and information between different blockchains.
Its native token, ATOM, powers the Cosmos blockchain. ATOM a utility token built on the Cosmos network and is used to pay for transaction fees and reward validators for helping maintain the network.
Here's how Cosmos and ATOM Coin work:
Cosmos is built on the Tendermint consensus algorithm, a Proof-of-Stake (PoS) consensus mechanism. The Cosmos network consists of many independent blockchains connected through a central hub called the Cosmos Hub.
This hub acts as a gateway for cross-chain communication, allowing different blockchains to exchange data and value. Developers can build decentralized applications (dApps) on the Cosmos network using the Cosmos SDK, a modular framework for building blockchain applications.
ATOM is used to power the operations of the Cosmos network. It is used to pay for transaction fees on the network, stake for network security, and participate in governance decisions.
Validators on the Cosmos network are rewarded in ATOM for validating transactions and maintaining network security.
There are several advantages to investing in Cosmos (ATOM) Crypto. Here are a few that you should know of:
As with any investment, there are some risks associated with investing in Cosmos (ATOM) including:
If you are interested in investing in Cosmos (ATOM) cryptocurrency, here are some strategies to consider:
Remember that investing in cryptocurrencies can be volatile and is not without risk. Conducting your research, understanding your risk tolerance, and considering your investment horizon before investing in Cosmos (ATOM) or any other cryptocurrency is important.
Cosmos is a blockchain platform that enables interoperability between different blockchains, while ATOM is the native cryptocurrency of the Cosmos network.
Here are some of the top exchanges to trade Cosmos (ATOM)
And remember to research and assess any exchange's reputation, security, and trading fees before trading. It's also important to consider the regulatory environment in your jurisdiction and ensure that the exchange you choose complies with applicable laws and regulations.
Cosmos has gained deserved attention for its potential to solve the problem of blockchain interoperability and fragmentation.
If you are actively looking to invest in cosmos, we suggest you need a thorough analysis and research before making a decision. Token Metrics helps with that.
Disclaimer:
The information provided on this website does not constitute investment advice, financial advice, trading advice, or any other sort of advice and you should not treat any of the website's content as such.
Token Metrics does not recommend that any cryptocurrency should be bought, sold, or held by you. Do conduct your own due diligence and consult your financial advisor before making any investment decisions.

Ethereum staking is a new way to earn rewards for holding ETH. It’s a process that involves depositing your Ether into a smart contract and receiving rewards in the form of ETH.
Ethereum staking has become increasingly popular over the past year and is expected to continue to grow. You can maximize your rewards and minimize your risks with the right approach. This article will explain Ethereum staking, its pros and cons, how to get started, and much more.
Ethereum staking is a way to earn rewards by depositing your ETH into a smart contract. It may require you to lock away your ETH in the contract for a certain period of time. But with liquid staking becoming popular, you can trade your staked tokens with ease. During this time, you will earn rewards based on the amount of Ethereum you have staked and the length of time you have staked for. Ethereum staking is a great way to earn passive income, as you don't have to manage your ETH actively.
The process of Ethereum staking works like this: you first need to choose a staking platform and deposit your ETH into a smart contract. The platform will then track your ETH and calculate your rewards. Once you have staked your ETH, you will receive rewards in the form of ETH. The rewards you receive can vary depending on the platform, the length of time you've staked for, and the amount of ETH you've staked.
Ethereum staking is an important part of the Ethereum network. It helps to secure the network and allows users to receive rewards for their contribution. By staking your ETH, you're helping to keep the Ethereum network secure and functioning properly.
Before you decide to stake your ETH, it’s important to understand the pros and cons of staking. Ethereum staking has the potential to be very profitable, but there are also some risks associated with it.
One of the biggest pros of staking Ethereum is that it's an easy way to earn passive income. You don't have to manage your ETH actively; you can earn rewards by holding onto it. The rewards can be significant depending on the platform and the amount of ETH you've staked.
Another pro of staking ETH is that it helps to secure the Ethereum network. By staking your ETH, you're helping to keep the network secure and functioning properly. This helps to ensure the overall success of the network and can be beneficial for everyone involved.
On the other hand, there are some risks associated with Ethereum staking.
One of the biggest risks is that you could lose your ETH if your platform goes out of business or is hacked. It's important to ensure you're only using trusted platforms and taking the necessary steps to secure your ETH.
Additionally, you won't be able to access your ETH until the staking period is complete (until it changes with upgrades), which could be months or years.
The process of staking ETH is relatively straightforward, but there are a few important steps you should take.
The first step is to choose a staking platform. Several different staking platforms are available, so it's important to research and choose one that fits your needs. You should also ensure that the platform is secure and that your ETH is safe.
Once you've chosen a platform, the next step is to deposit your ETH into the platform's smart contract. You'll need to enter the amount of ETH you want to stake, and the time you want to stake for.
That's it, you are now earning ETH as long as you are staked.
Ethereum staking pools are important because it allows you to stake any amount of ETH. If they did not exist, you would need to stake at least 32 ETH to become a validator. Pooling allows everyone to contribute ETH to fullfill the required amount of ETH to start staking.
There are several different staking pools available, so it's important to do your research and choose one that fits your needs. Most staking pools have a minimum amount of ETH you need to stake, so make sure you know this before joining. Additionally, some pools may charge fees for their services, so make sure to factor this into your decision.
The amount of rewards you can earn from staking ETH can vary depending on the platform you're using, the amount of ETH you've staked, and the length of time you've staked for. Generally speaking, the more ETH you stake and the longer you stake for, the more rewards you'll receive.
The rewards you receive can also vary depending on the staking pool you're using. Some pools may offer higher rewards than others, so it's important to research and choose one that fits your needs.
Ethereum staking can be a profitable way to earn passive income, but it’s important to understand the risks involved. As with any investment, there’s always a chance that you could lose your ETH if the platform you’re using gets hacked. Additionally, you won’t be able to access your ETH until the staking period is complete, so make sure you're aware of this before getting started.
Overall, Ethereum staking can be a great way to earn passive income, but it's important to research and understand the risks before getting started. If you're willing to take risks and do your due diligence, Ethereum staking can be a great way to earn rewards.
Ethereum staking is a great way to earn rewards for holding onto your ETH. It's a process that involves depositing your ETH into a smart contract and receiving rewards in the form of ETH.
You can maximize your rewards and minimize your risks with the right approach. This article explains ethereum staking, its pros and cons, how to get started with it, and much more. If you're looking for a way to earn passive income, Ethereum staking could be a great option for you.

When you understand the dynamics of the crypto markets, one of the most important tools at your disposal is the crypto Fear and Greed Index. This index provides an easy-to-understand snapshot of the collective sentiment in the crypto markets.
In this article, we'll take a closer look at the Fear and Greed Index, exploring what it is, how to use it, and how it can help you make better decisions in the crypto markets.
The Crypto Fear and Greed Index is a tool that measures the sentiment in the crypto markets. It considers a range of factors, including market volatility, trading volume, and the price movements of major cryptocurrencies. The index assigns a score to each of these factors, and then uses those scores to calculate an overall fear and greed score. The score then indicates whether the market is in fear, greed, or neutrality.
The Fear and Greed Index has become increasingly popular among crypto traders and investors as it provides a useful way to gauge the current market sentiment. This can help traders and investors make more informed decisions about when to enter and exit the markets.
The Fear and Greed Index has several key features that make it an invaluable tool for traders and investors.
1. It provides an easy-to-understand snapshot of the current market sentiment. This can help traders and investors decide quickly when to enter or exit the markets.
2. The index is updated regularly and is based on real-time data. This ensures that the index is always up-to-date and accurately reflects the current market sentiment.
3. The index is highly customizable. Users can configure the index to include only the factors most relevant to their trading strategy. This helps ensure that users get an accurate picture of the market sentiment tailored to their specific needs.
4. The index is free to use and is available on various platforms, including mobile and desktop apps. This ensures that users can access the index from wherever they are.
Using the Fear and Greed Index is relatively straightforward. Once you've set up the index, you'll be presented with a chart displaying the current fear and greed score. This score will range from 0 to 100, with 0 being the most fearful and 100 being the most greedy.
The score can determine when it's best to enter or exit the markets. Generally speaking, a score of 0 to 30 indicates that the market is in a state of fear, while a score of 70 to 100 indicates that the market is in a state of greed. If the score is between these two ranges, it indicates that the market is in a state of neutrality.
It is important to note that the Fear and Greed Index is not a predictive tool but rather a tool to help traders and investors better understand the current market sentiment. As such, it should not be used as the basis for trading decisions.
The Fear and Greed Index is calculated using various factors, including market volatility, trading volume, and the price movements of major cryptocurrencies. Each of these factors is assigned a score, which is then used to calculate an overall fear and greed score.
The algorithm is constantly being updated to reflect the current market sentiment accurately. Users can customize the index to include only the factors most relevant to their trading strategy.
The Fear and Greed Index is best used as a short-term indicator. This is because it is based on real-time data, constantly updated to reflect the current market sentiment.
However, it can also be used as a long-term indicator. For example, if the Fear and Greed Index consistently shows a score of 0 to 30, it could indicate that the market is in a state of prolonged fear, which could signify that it is time to start buying.
Where Can I Access the Crypto Fear and Greed Index?
The Fear and Greed Index is available on the Token Metrics Market page with the name called Bull and Bear.
One strategy for using the Fear and Greed Index is to look for divergences between the index and the price movements of major cryptocurrencies. For example, if the Fear and Greed Index is showing a score of 0 to 30, but the price of Bitcoin is increasing, this could indicate that there is buying pressure in the market and that it might be a good time to buy.
Another strategy is to use the Fear and Greed Index as a confirmation tool. For example, if the Fear and Greed Index is showing a score of 0 to 30 and other indicators also indicate that it's a good time to buy, then this could be taken as a confirmation that it is indeed a good time to buy.
Also Read - Why is Crypto Crashing? - Everything You Need to Know
The Fear and Greed Index is a powerful tool for traders and investors looking to understand the current market sentiment. It provides an easy-to-understand snapshot of the market sentiment and is updated regularly to ensure that it is always up-to-date.
However, it should not be used as the sole basis for trading decisions. Instead, it should be used with other indicators and techniques to help traders and investors make more informed decisions about when to enter and exit the markets.
The information provided on this website does not constitute investment advice, financial advice, trading advice, or any other sort of advice and you should not treat any of the website's content as such.
Token Metrics does not recommend that any cryptocurrency should be bought, sold, or held by you. Do conduct your own due diligence and consult your financial advisor before making any investment decisions.


 Create Your Free Account
9450 SW Gemini Dr
PMB 59348
Beaverton, Oregon 97008-7105 US
.svg)


.png)
Token Metrics Media LLC is a regular publication of information, analysis, and commentary focused especially on blockchain technology and business, cryptocurrency, blockchain-based tokens, market trends, and trading strategies.
Token Metrics Media LLC does not provide individually tailored investment advice and does not take a subscriber’s or anyone’s personal circumstances into consideration when discussing investments; nor is Token Metrics Advisers LLC registered as an investment adviser or broker-dealer in any jurisdiction.
Information contained herein is not an offer or solicitation to buy, hold, or sell any security. The Token Metrics team has advised and invested in many blockchain companies. A complete list of their advisory roles and current holdings can be viewed here: https://tokenmetrics.com/disclosures.html/
Token Metrics Media LLC relies on information from various sources believed to be reliable, including clients and third parties, but cannot guarantee the accuracy and completeness of that information. Additionally, Token Metrics Media LLC does not provide tax advice, and investors are encouraged to consult with their personal tax advisors.
All investing involves risk, including the possible loss of money you invest, and past performance does not guarantee future performance. Ratings and price predictions are provided for informational and illustrative purposes, and may not reflect actual future performance.


%20Price%20Prediction%20.webp)


%20Price%20Prediction.webp)


